


¡La leyenda en el equipo de InstaSpot!
¡Leyenda! ¿Cree que es una retórica grandilocuente? Pero, ¿cómo deberíamos llamar a un hombre, que se convirtió en el primer asiático en ganar el campeonato mundial de ajedrez júnior a los 18 años y en el primer Gran Maestro indio a los 19 años? Ese fue el comienzo de un camino difícil hacia el título de Campeón del Mundo para Viswanathan Anand, el hombre que se convirtió en parte de la historia del ajedrez para siempre. ¡Ahora una leyenda más en el equipo de InstaSpot!


Borussia es uno de los clubes de fútbol con más títulos en Alemania, que ha demostrado repetidamente a los fanáticos: el espíritu de competencia y liderazgo que ciertamente conducirán al éxito. Opere de la misma manera que los profesionales del deporte: con confianza y de forma activa. ¡Mantenga un "pase" del Borussia FC y lidere con InstaSpot!
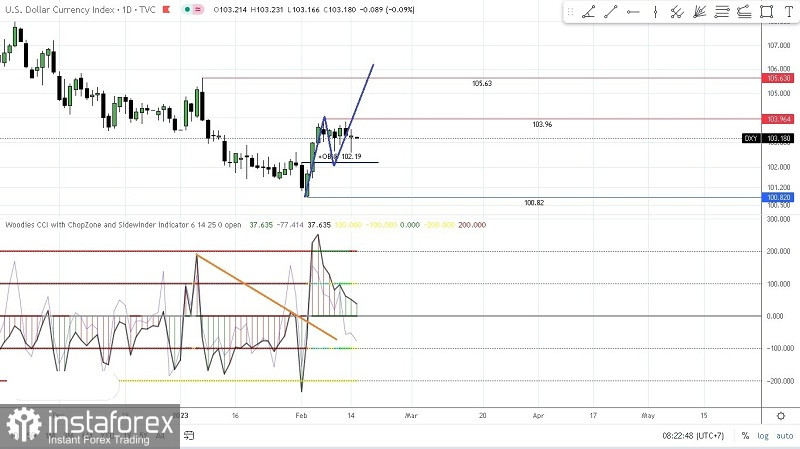
On the daily chart of the USD Dollar Index, it can be seen that there was a trendline break (TLB) condition on the CCI (14) indicator which was previously in a bear condition where the Chop Zone (CZ) indicator (levels 100 & -100) was red but after that TLB and CCI move above level 0, so CZ changes color to cyan blue and now the CCI histogram (14) has turned green, followed by Sidewinder color (levels 200 & -200) changes color to yellow (volatile/Trending) and green (very volatile / trending) so that in the future USDX has the potential to be Bullish appreciated going up to the 103.96 level as the first target and the 105.63 level as the second target but before that it seems that USDX will be corrected down to test the 102.19 level and as long as this level is strong enough to hold back the pace correction and does not exceed the level of 100.82, USDX has the potential to strengthen again where this can be seen at CCI 914) is trying to form Zero Line Reject (ZLR) pattern.
(Disclaimer)
*El análisis de mercado publicado aquí tiene la finalidad de incrementar su conocimiento, más no darle instrucciones para realizar una operación.
¡Los informes analíticos de InstaSpot lo mantendrá bien informado de las tendencias del mercado! Al ser un cliente de InstaSpot, se le proporciona una gran cantidad de servicios gratuitos para una operación eficiente.


