


Đội ngũ của chúng tôi có hơn 7,000,000 thương nhân!
Hàng ngày chúng tôi làm việc cùng nhau để cải thiện việc giao dịch. Chúng tôi nhận được kết quả cao và luôn tiến lên phía trước.
Sự công nhận của hàng triệu thương nhân trên toàn thế giới là sự đánh giá tốt nhất cho công việc của chúng tôi! Bạn đã đưa ra quyết định của mình và chúng tôi sẽ làm mọi thứ cần thiết để đáp ứng mong đợi của bạn!
Chúng ta cùng với nhau sẽ là một nhóm tuyệt vời!
InstaSpot. Tự hào làm việc cho bạn!


Diễn viên, nhà vô địch mùa giải UFC 6 và là người hùng thật sự!
Người tự mình làm nên tất cả. Người đàn ông đáng kể học hỏi.
Bí mật đằng sau thành công của Taktarov là sự cố gắng liên tục hướng tới mục tiêu.
Hãy khai phá tất cả các mặt tài năng của bạn!
Khám phá, thử, thất bại - nhưng không bao giờ dừng lại!
InstaSpot. Câu chuyện thành công của bạn bắt đầu từ đây!
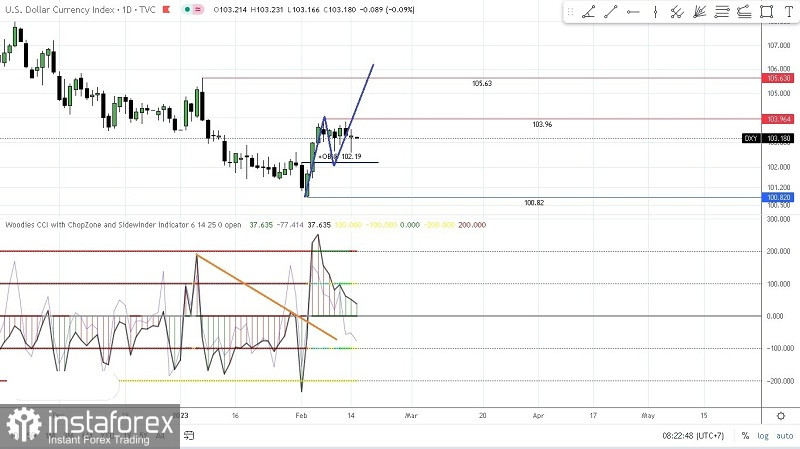
On the daily chart of the USD Dollar Index, it can be seen that there was a trendline break (TLB) condition on the CCI (14) indicator which was previously in a bear condition where the Chop Zone (CZ) indicator (levels 100 & -100) was red but after that TLB and CCI move above level 0, so CZ changes color to cyan blue and now the CCI histogram (14) has turned green, followed by Sidewinder color (levels 200 & -200) changes color to yellow (volatile/Trending) and green (very volatile / trending) so that in the future USDX has the potential to be Bullish appreciated going up to the 103.96 level as the first target and the 105.63 level as the second target but before that it seems that USDX will be corrected down to test the 102.19 level and as long as this level is strong enough to hold back the pace correction and does not exceed the level of 100.82, USDX has the potential to strengthen again where this can be seen at CCI 914) is trying to form Zero Line Reject (ZLR) pattern.
(Disclaimer)
*Phân tích thị trường được đăng tải ở đây có nghĩa là để gia tăng nhận thức của bạn, nhưng không đưa ra các chỉ dẫn để thực hiện một giao dịch.
InstaSpot analytical reviews will make you fully aware of market trends! Being an InstaSpot client, you are provided with a large number of free services for efficient trading.


