


The legend in the InstaSpot team!
Legend! You think that's bombastic rhetoric? But how should we call a man, who became the first Asian to win the junior world chess championship at 18 and who became the first Indian Grandmaster at 19? That was the start of a hard path to the World Champion title for Viswanathan Anand, the man who became a part of history of chess forever. Now one more legend in the InstaSpot team!


Borussia is one of the most titled football clubs in Germany, which has repeatedly proved to fans: the spirit of competition and leadership will certainly lead to success. Trade in the same way that sports professionals play the game: confidently and actively. Keep a "pass" from Borussia FC and be in the lead with InstaSpot!
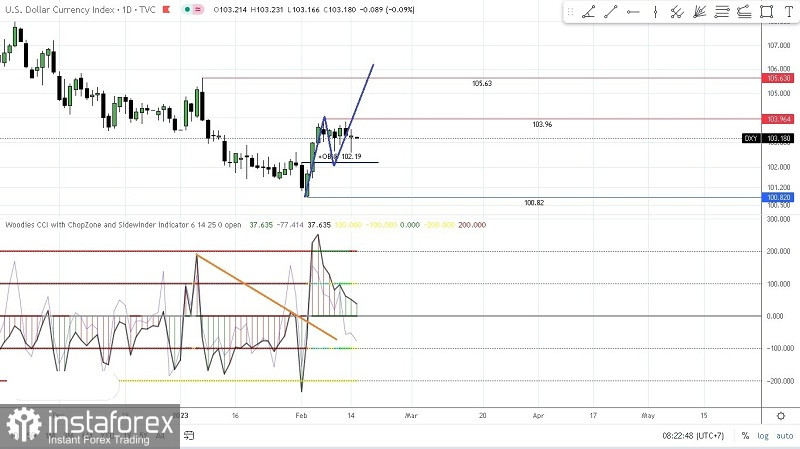
On the daily chart of the USD Dollar Index, it can be seen that there was a trendline break (TLB) condition on the CCI (14) indicator which was previously in a bear condition where the Chop Zone (CZ) indicator (levels 100 & -100) was red but after that TLB and CCI move above level 0, so CZ changes color to cyan blue and now the CCI histogram (14) has turned green, followed by Sidewinder color (levels 200 & -200) changes color to yellow (volatile/Trending) and green (very volatile / trending) so that in the future USDX has the potential to be Bullish appreciated going up to the 103.96 level as the first target and the 105.63 level as the second target but before that it seems that USDX will be corrected down to test the 102.19 level and as long as this level is strong enough to hold back the pace correction and does not exceed the level of 100.82, USDX has the potential to strengthen again where this can be seen at CCI 914) is trying to form Zero Line Reject (ZLR) pattern.
(Disclaimer)
*这里的市场分析是为了增加您对市场的了解,而不是给出交易的指示。
InstaSpot分析评论将让您充分了解市场趋势! 作为InstaSpot的客户,您将获得大量的免费服务以实现有效的交易。


