


فريقنا لديه أكثر من 7,000,000 من التجار!
كل يوم نعمل معا لتحسين التداول. نحصل على نتائج عالية ونمضي قدما.
الاعتراف من قبل الملايين من التجار في جميع أنحاء العالم هو أفضل تقدير لعملنا! لقد قمت باختيارك وسنفعل كل ما يلزم لتلبية توقعاتك!
نحن فريق رائع معا!
إنستافوركس تعتز بالعمل بالنسبة لك!


الممثل وبطل مسابقة يو إف سي 6 وبطل حقيقي!
الرجل الذي حقق النجاح بعمله الدؤوب. الرجل الذي يذهب كما نريد.
سر نجاح تاكتاروف هو حركة مستمرة نحو الهدف.
اكشف عن جميع جوانب موهبتك!
اكتشف، وحاول، وافشل - ولكن لا تتوقف أبدا!
إنستافوركس. تبدأ قصة نجاحك من هنا!
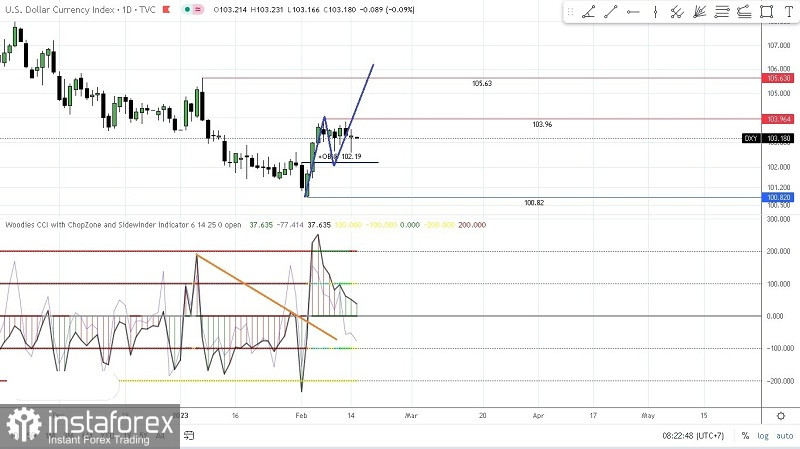
On the daily chart of the USD Dollar Index, it can be seen that there was a trendline break (TLB) condition on the CCI (14) indicator which was previously in a bear condition where the Chop Zone (CZ) indicator (levels 100 & -100) was red but after that TLB and CCI move above level 0, so CZ changes color to cyan blue and now the CCI histogram (14) has turned green, followed by Sidewinder color (levels 200 & -200) changes color to yellow (volatile/Trending) and green (very volatile / trending) so that in the future USDX has the potential to be Bullish appreciated going up to the 103.96 level as the first target and the 105.63 level as the second target but before that it seems that USDX will be corrected down to test the 102.19 level and as long as this level is strong enough to hold back the pace correction and does not exceed the level of 100.82, USDX has the potential to strengthen again where this can be seen at CCI 914) is trying to form Zero Line Reject (ZLR) pattern.
(Disclaimer)
*The market analysis posted here is meant to increase your awareness, but not to give instructions to make a trade.
InstaSpot analytical reviews will make you fully aware of market trends! Being an InstaSpot client, you are provided with a large number of free services for efficient trading.


