


Our team has over 7,000,000 traders!
Every day we work together to improve trading. We get high results and move forward.
Recognition by millions of traders all over the world is the best appreciation of our work! You made your choice and we will do everything it takes to meet your expectations!
We are a great team together!
InstaSpot. Proud to work for you!


Actor, UFC 6 tournament champion and a true hero!
The man who made himself. The man that goes our way.
The secret behind Taktarov's success is constant movement towards the goal.
Reveal all the sides of your talent!
Discover, try, fail - but never stop!
InstaSpot. Your success story starts here!

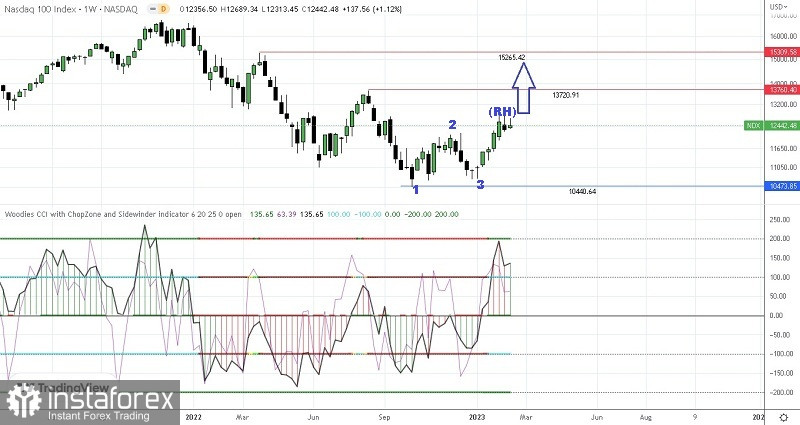
If we pay attention on the weekly chart of Nasdaq 100 index, then we can see this few things:
1. Sidewinder (SI) indicator in green which means trending and volatile once.
2. Chopzone (CZ) indicator in cyan blue which means NDX100 condition on the weekly chart is Bullish.
3. Zero Line (ZL) Indicator in green which indicates price is above its LSMA 25-(Bull).
4. Bullish 123 pattern appearance followed by Ross Hook (RH).
Then according to 4 facts above, Nasdaq 100 index on its weekly chart is on healthy Bullish condition so in a few days ahead has the potential to appreciated up to the level 13720,91 as the first target and 15265,42 as the second target if it manages to break above its Ross Hook on the level 11906,11. But pay attention that if on its way to the described targets before suddenly NDX100 corrected down to the level 10440,64 then all of the Bull scenarios that has been explained before will be invalid and cancel by itself.
(Disclaimer)
*The market analysis posted here is meant to increase your awareness, but not to give instructions to make a trade.
InstaSpot analytical reviews will make you fully aware of market trends! Being an InstaSpot client, you are provided with a large number of free services for efficient trading.


