


La légende dans l'équipe InstaSpot!
La vraie légende! Vous pensez que c'est trop pathétique? Mais comment pouvez-vous appeler un homme qui, à 18 ans, est devenu le premier champion du monde d'échecs parmi les jeunes hommes d'Asie, et à dix-neuf ans – le premier grand maître de l'histoire de son pays? Ce fut le début de la voie du champion d'échecs –Viswanathan Anand – l'homme qui a inscrit son nom à jamais dans l'histoire des échecs du monde. Une autre légende dans l'équipe d'InstaSpot!


Le FC Borussia est l'un des clubs de football les plus titrés d'Allemagne, qui a prouvé à maintes reprises à ses fans que l'esprit de rivalité et de leadership mènera certainement au succès. Négociez de la même manière que les professionnels du sport mènent le jeu: en toute confiance et activement. Devenez un leader avec le FC Borussia et soyez en tête avec l'équipe InstaSpot!
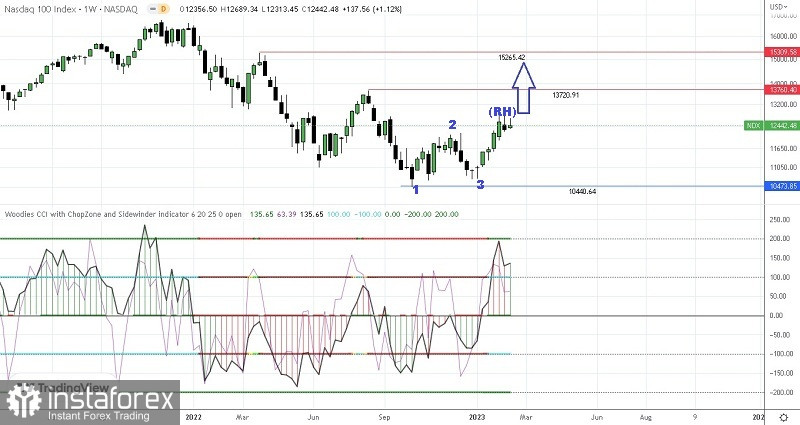
If we pay attention on the weekly chart of Nasdaq 100 index, then we can see this few things:
1. Sidewinder (SI) indicator in green which means trending and volatile once.
2. Chopzone (CZ) indicator in cyan blue which means NDX100 condition on the weekly chart is Bullish.
3. Zero Line (ZL) Indicator in green which indicates price is above its LSMA 25-(Bull).
4. Bullish 123 pattern appearance followed by Ross Hook (RH).
Then according to 4 facts above, Nasdaq 100 index on its weekly chart is on healthy Bullish condition so in a few days ahead has the potential to appreciated up to the level 13720,91 as the first target and 15265,42 as the second target if it manages to break above its Ross Hook on the level 11906,11. But pay attention that if on its way to the described targets before suddenly NDX100 corrected down to the level 10440,64 then all of the Bull scenarios that has been explained before will be invalid and cancel by itself.
(Disclaimer)
*The market analysis posted here is meant to increase your awareness, but not to give instructions to make a trade.
InstaSpot analytical reviews will make you fully aware of market trends! Being an InstaSpot client, you are provided with a large number of free services for efficient trading.


