


الأسطورة فى فريق إنستافوركس!
الأسطورة! هل تعتقد أن هذا هو الخطاب المنمق؟ ولكن كيف ينبغي أن نطلق على الرجل، الذي أصبح أول آسيوي يفوز ببطولة العالم للشطرنج للشباب بعمر 18 سنة والذي أصبح أول أستاذ كبير هندي في سن 19؟ وكانت هذه بداية طريق صعب إلى لقب بطل العالم لـ فيسواناثان أناند، الرجل الذي أصبح جزءًا من تاريخ الشطرنج إلى الأبد. والآن أسطورة آخر في فريق إنستافوركس!


يعتبر بوروسيا دورتموند أحد أكثر أندية كرة القدم حصولاً على الألقاب في ألمانيا، وقد أثبت ذلك مرارًا وتكرارًا للجماهير: فإنّ روح المنافسة والقيادة ستؤدي بالتأكيد إلى النجاح. قم بالتداول بنفس الطريقة التي يلعب بها المحترفون الرياضيون اللعبة: بثقة ونشاط. احتفظ بـ "ترخيص دخول" من نادي بوروسيا دورتموند لكرة القدم وكن في الصدارة مع إنستافوركس!
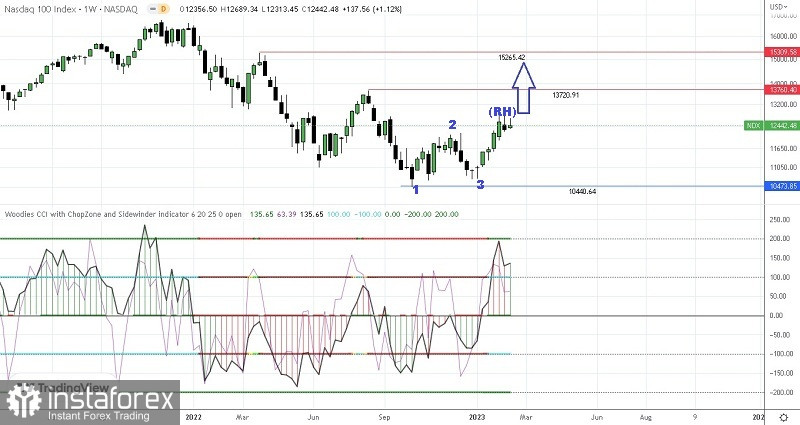
If we pay attention on the weekly chart of Nasdaq 100 index, then we can see this few things:
1. Sidewinder (SI) indicator in green which means trending and volatile once.
2. Chopzone (CZ) indicator in cyan blue which means NDX100 condition on the weekly chart is Bullish.
3. Zero Line (ZL) Indicator in green which indicates price is above its LSMA 25-(Bull).
4. Bullish 123 pattern appearance followed by Ross Hook (RH).
Then according to 4 facts above, Nasdaq 100 index on its weekly chart is on healthy Bullish condition so in a few days ahead has the potential to appreciated up to the level 13720,91 as the first target and 15265,42 as the second target if it manages to break above its Ross Hook on the level 11906,11. But pay attention that if on its way to the described targets before suddenly NDX100 corrected down to the level 10440,64 then all of the Bull scenarios that has been explained before will be invalid and cancel by itself.
(Disclaimer)
*The market analysis posted here is meant to increase your awareness, but not to give instructions to make a trade.
InstaSpot analytical reviews will make you fully aware of market trends! Being an InstaSpot client, you are provided with a large number of free services for efficient trading.


