


我们的团队有超过700万的操盘手!
我们每天都在一起努力改善交易。我们得到了很高的成绩,并继续前进。
世界各地数以百万计的操盘手的认可是我们工作的最大赞赏! 您做出了您的选择,我们将尽一切努力来满足您的期望!
我们是一个共同的伟大团队!
InstaSpot. 自豪地为您工作!


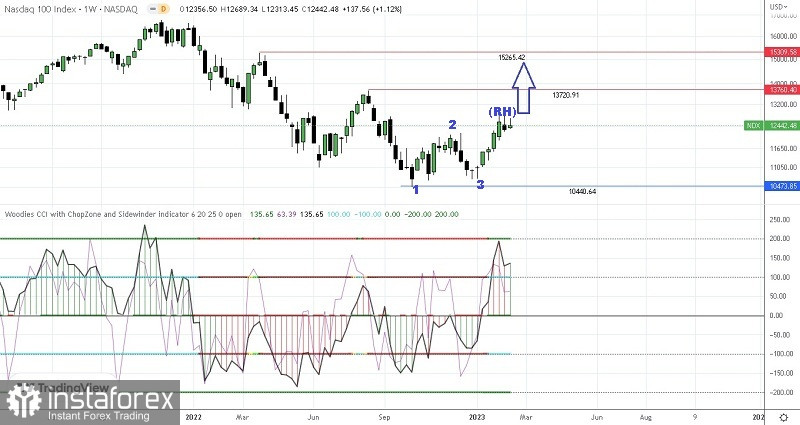
If we pay attention on the weekly chart of Nasdaq 100 index, then we can see this few things:
1. Sidewinder (SI) indicator in green which means trending and volatile once.
2. Chopzone (CZ) indicator in cyan blue which means NDX100 condition on the weekly chart is Bullish.
3. Zero Line (ZL) Indicator in green which indicates price is above its LSMA 25-(Bull).
4. Bullish 123 pattern appearance followed by Ross Hook (RH).
Then according to 4 facts above, Nasdaq 100 index on its weekly chart is on healthy Bullish condition so in a few days ahead has the potential to appreciated up to the level 13720,91 as the first target and 15265,42 as the second target if it manages to break above its Ross Hook on the level 11906,11. But pay attention that if on its way to the described targets before suddenly NDX100 corrected down to the level 10440,64 then all of the Bull scenarios that has been explained before will be invalid and cancel by itself.
(Disclaimer)
*这里的市场分析是为了增加您对市场的了解,而不是给出交易的指示。
InstaSpot分析评论将让您充分了解市场趋势! 作为InstaSpot的客户,您将获得大量的免费服务以实现有效的交易。


