


Nella nostra squadra ci sono più di 7.000.000 trader! Ogni giorno ci impegniamo a far sì che il trading migliori. Conseguiamo grandi risultati e ci muoviamo in avanti.
Il riconoscimento da parte di milioni di trader in tutto il mondo rappresenta l'alta valutazione della nostra attività! Voi avete fatto la vostra scelta e noi faremo la nostra al fine di soddisfare le vostre aspettative!
Assieme siamo una grande squadra!
InstaSpot. Siamo orgogliosi di lavorare per voi!


Attore, campione del mondo di lotta libera e semplicemente un vero maciste russo! Persona venuta dal nulla. Persona che rispecchia i nostri obiettivi. Il segreto del successo di Taktarov consiste nel mirare continuamente al suo scopo.
Dischiudi anche tu tutti gli aspetti del tuo talento! Impara, prova, sbaglia, ma non fermarti!
InstaSpot - la storia delle tue vittorie inizia qui!

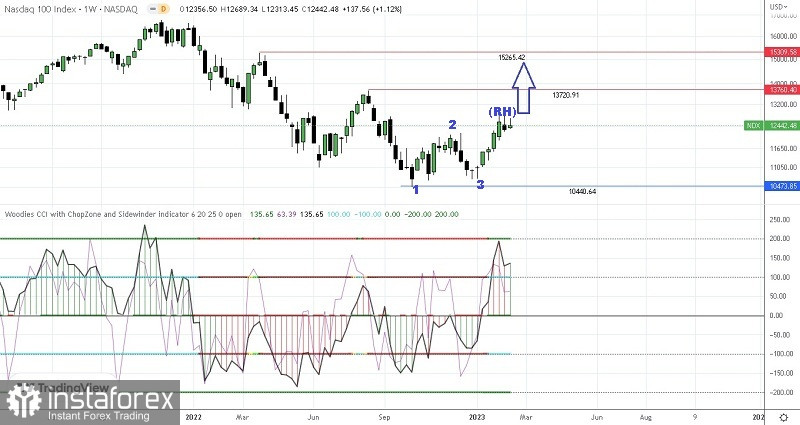
If we pay attention on the weekly chart of Nasdaq 100 index, then we can see this few things:
1. Sidewinder (SI) indicator in green which means trending and volatile once.
2. Chopzone (CZ) indicator in cyan blue which means NDX100 condition on the weekly chart is Bullish.
3. Zero Line (ZL) Indicator in green which indicates price is above its LSMA 25-(Bull).
4. Bullish 123 pattern appearance followed by Ross Hook (RH).
Then according to 4 facts above, Nasdaq 100 index on its weekly chart is on healthy Bullish condition so in a few days ahead has the potential to appreciated up to the level 13720,91 as the first target and 15265,42 as the second target if it manages to break above its Ross Hook on the level 11906,11. But pay attention that if on its way to the described targets before suddenly NDX100 corrected down to the level 10440,64 then all of the Bull scenarios that has been explained before will be invalid and cancel by itself.
(Disclaimer)
*La presente analisi del mercato ha un carattere esclusivamente informativo e non rappresenta una guida per l`effettuazione di una transazione.
Le recensioni analitiche di InstaSpot ti renderanno pienamente consapevole delle tendenze del mercato! Essendo un cliente InstaSpot, ti viene fornito un gran numero di servizi gratuiti per il trading efficiente.


