




The S&P 500 continues its steady ascent, consolidating in early Monday's Asian session just below the all-time high reached above 7,780.0 and near 7,745.0. The market is digesting the implications of weak US labor market data, which reduced expectations of a Fed rate hike, while lingering geopolitical uncertainty in the Middle East is limiting investor risk appetite.
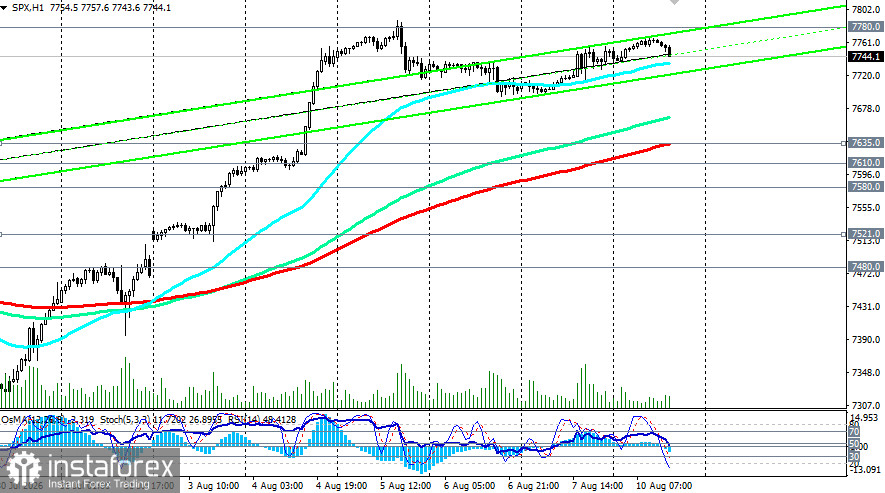
The key event of the week will be US inflation data, which could determine the index's next move.
Last week was marked by an impressive rally: the S&P 500 posted its best weekly gain since April, closing near the record level of 7,748.0. The index rose by approximately 3.7% from the previous week's closing price and currently holds above 7,740.0.
Repricing of Fed rate expectations. The weak July NFP report (-23,000 jobs vs. +80,000 expected) and downward revisions to June data to +20,000 fundamentally altered market expectations. The probability of a Fed rate hike in September declined, creating a favorable backdrop for risk assets. Soft employment data is typically read as a "green light" for the Fed to maintain its pause.
Strong earnings season. The corporate earnings season significantly exceeded expectations. 87% of S&P 500 companies reported earnings above estimates, a record high. Second-quarter profit growth accelerated to 33% from 25% in the first quarter, one of the highest readings outside post-recession recovery periods. All 11 sectors are showing positive momentum, with 8 of them reporting double-digit growth.
Recovery of the AI trade. Following June's correction, the Philadelphia Semiconductor Index (SOX) rose by 9.24% for the week, confirming renewed interest in the AI sector. Tech giants (Microsoft, Amazon) confirmed that aggressive AI infrastructure investments are delivering tangible financial returns.
Reduced geopolitical tensions. Hopes for a diplomatic resolution in the Strait of Hormuz and the cancellation of planned strikes on Iran created a positive backdrop. However, lingering uncertainty (Iran has set conditions for reopening the strait) continues to weigh on the market.
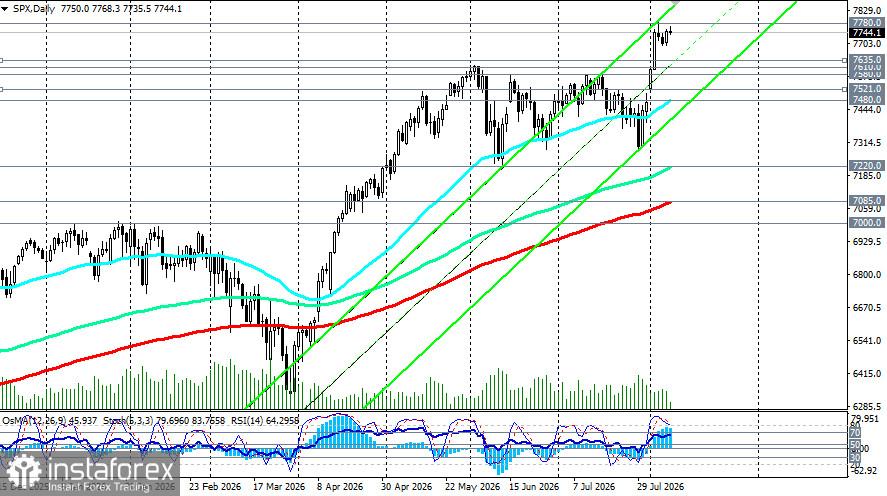
From a technical standpoint, the S&P 500 maintains bullish momentum, consolidating above key moving averages.
Key events to watch
| Date | Event | Forecast / Expectation | Expected impact on S&P 500 |
|---|---|---|---|
| Wednesday, Aug 12 | US CPI (July) | Forecast: +3,4% y/y | Weak data = support, strong data = pressure |
| Thursday, Aug 13 | US PPI (July) | — | Secondary inflation indicator |
| This week | Cisco, Applied Materials, CoreWeave reports | — | Key drivers of tech sector |
The S&P 500 is at record highs, where a strong fundamental backdrop (record earnings season, upward profit revisions) meets macroeconomic uncertainty (inflation data, Fed rate expectations). The key event of the week will be Wednesday's CPI data, which could determine whether the index can hold above 7,800.0 and continue toward 7,900.0-8,000.0 or reverse toward the support zone of 7,635.0-7,580.0.
As long as fundamental indicators continue to improve, the S&P 500 has potential for further gains. Goldman Sachs, for example, forecasts the index reaching 8,000.0 by year-end if current trends persist.
*এখানে পোস্ট করা মার্কেট বিশ্লেষণ আপনার সচেতনতা বৃদ্ধির জন্য প্রদান করা হয়, ট্রেড করার নির্দেশনা প্রদানের জন্য প্রদান করা হয় না।
ইন্সটাফরেক্স বিশ্লেষণমূলক পর্যালোচনাগুলো আপনাকে মার্কেট প্রবণতা সম্পর্কে পুরোপুরি সচেতন করবে! ইন্সটাফরেক্সের একজন গ্রাহক হওয়ায়, দক্ষ ট্রেডিং এর জন্য আপনাকে অনেক সেবা বিনামূল্যে প্রদান করা হয়।










