


¡Nuestro equipo cuenta con más de 7,000,000 operadores!
Cada día, trabajamos juntos para mejorar las operaciones. Obtenemos grandes resultados y seguimos adelante.
El reconocimiento de millones de operadores en todo el mundo es el mejor agradecimiento a nuestro trabajo! ¡Usted hizo su elección y haremos todo lo que esté a nuestro alcance para satisfacer sus expectativas!
¡Juntos somos un gran equipo!
InstaSpot. ¡Orgulloso de trabajar para usted!


¡Actor, 6 veces ganador del torneo UFC y un verdadero héroe!
El hombre que se hizo a sí mismo. El hombre que sigue nuestro camino.
El secreto detrás del éxito de Taktarov es el constante movimiento hacia el objetivo.
¡Revele todo los lados de su talento!
Descubra, intente, fracase, ¡pero nunca se rinda!
InstaSpot. ¡Su historia de éxito comienza aquí!
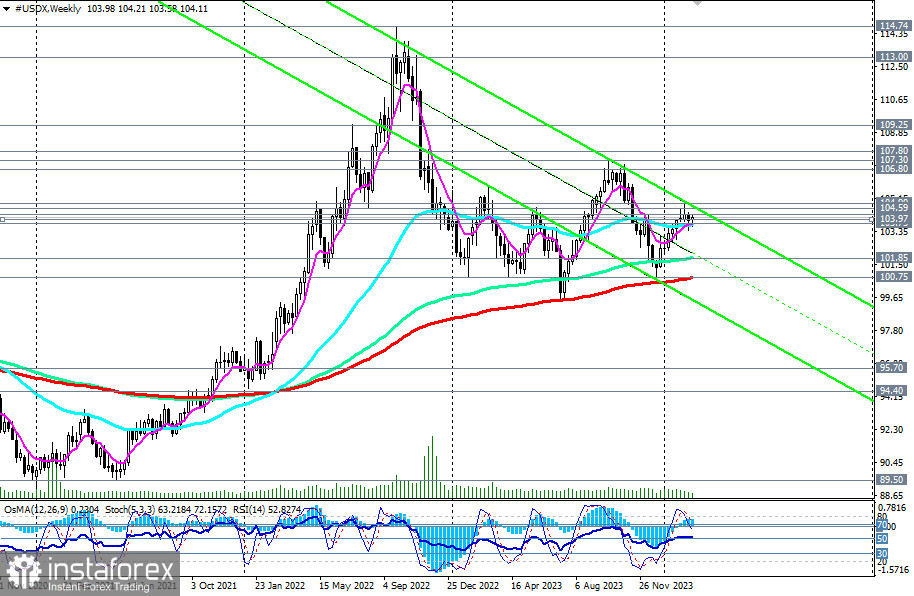
The Dollar Index (CFD #USDX on the MT4 platform) continues to trade within the zone of a long-term bullish market, notably above the key support level of 100.75 (200 EMA on the weekly chart).
Throughout the past month, DXY has predominantly operated within the realm of a medium-term bullish market, bounded by the support level of 103.75 (200 EMA on the daily chart).
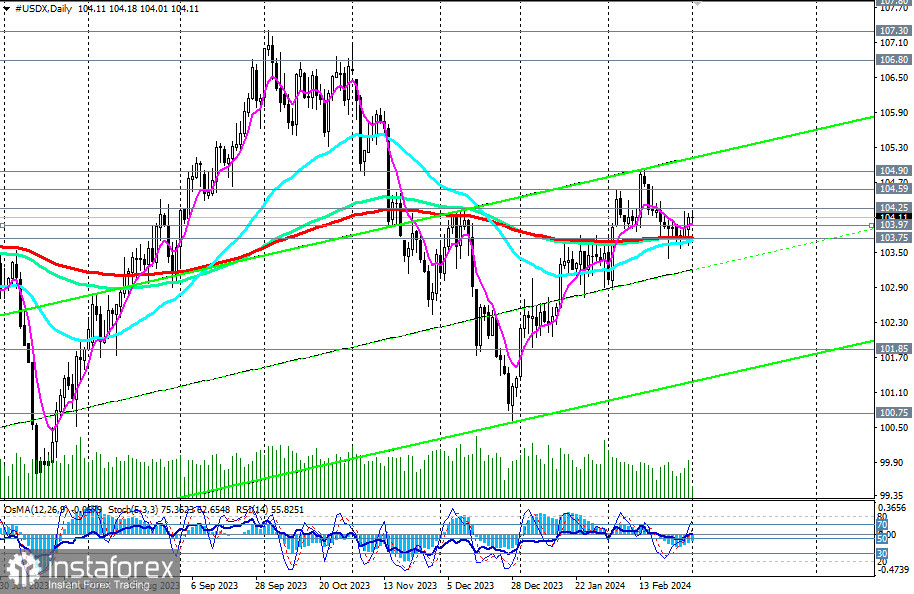
Technical indicators RSI, OsMA, and Stochastic on both daily and weekly charts also favor buyers, signaling the relevance of holding long-term and medium-term positions.
A breakthrough of the local resistance level at 104.25 could serve as the earliest signal for new purchases. The potential targets (within a 2 or 3-month interval) include the October highs and the levels of 106.50, 106.80, 107.00, 107.30, unless negative macro indicators, particularly CPI indices, begin to emerge from the U.S., altering the scenario.
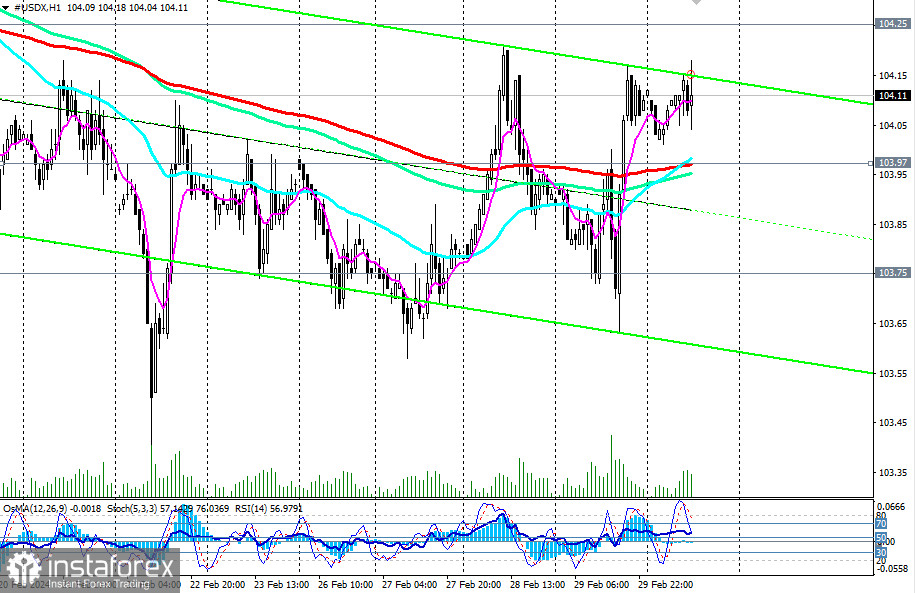
In an alternative scenario, a breakthrough of the key support level at 103.75 may signal the initiation of short positions. Further decline would lead DXY into the medium-term bearish market zone, once again favoring short positions with targets at key support levels of 101.85 (144 EMA on the weekly chart), 101.00, 100.75 (200 EMA on the weekly chart), 100.00, thereby distinguishing the long-term bullish market from the bearish one.
The future dynamics of the dollar and its DXY index will be closely tied to the fundamental background and the actions of the Federal Reserve.
Support levels: 104.00, 103.97, 103.75, 103.40, 103.00, 102.00, 101.85, 101.00, 100.75, 100.00
Resistance levels: 104.25, 104.59, 104.90, 105.00, 106.00, 106.80, 107.00, 107.30
Trading Scenarios
Primary Scenario: Buy Stop at 104.30. Stop-Loss at 103.60. Targets at 104.59, 104.90, 105.00, 106.00, 106.80, 107.00, 107.30
Alternative Scenario: Sell Stop at 103.60. Stop-Loss at 104.30. Targets at 103.40, 103.00, 102.00, 101.85, 101.00, 100.75, 100.00
"Targets" correspond to support/resistance levels. This does not guarantee their achievement but can serve as a reference when planning and placing trading positions.
*El análisis de mercado publicado aquí tiene la finalidad de incrementar su conocimiento, más no darle instrucciones para realizar una operación.
¡Los informes analíticos de InstaSpot lo mantendrá bien informado de las tendencias del mercado! Al ser un cliente de InstaSpot, se le proporciona una gran cantidad de servicios gratuitos para una operación eficiente.


