


Our team has over 7,000,000 traders!
Every day we work together to improve trading. We get high results and move forward.
Recognition by millions of traders all over the world is the best appreciation of our work! You made your choice and we will do everything it takes to meet your expectations!
We are a great team together!
InstaSpot. Proud to work for you!


Actor, UFC 6 tournament champion and a true hero!
The man who made himself. The man that goes our way.
The secret behind Taktarov's success is constant movement towards the goal.
Reveal all the sides of your talent!
Discover, try, fail - but never stop!
InstaSpot. Your success story starts here!

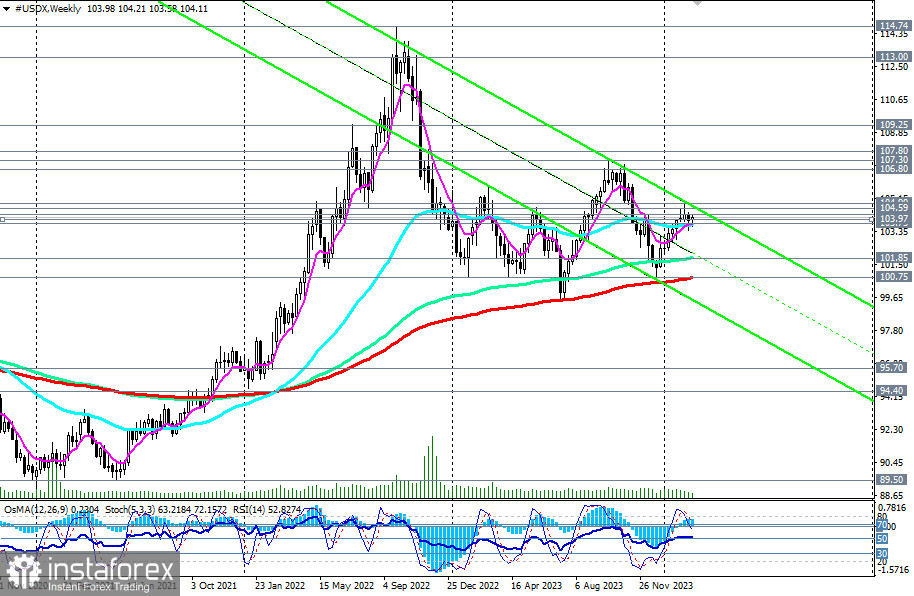
The Dollar Index (CFD #USDX on the MT4 platform) continues to trade within the zone of a long-term bullish market, notably above the key support level of 100.75 (200 EMA on the weekly chart).
Throughout the past month, DXY has predominantly operated within the realm of a medium-term bullish market, bounded by the support level of 103.75 (200 EMA on the daily chart).
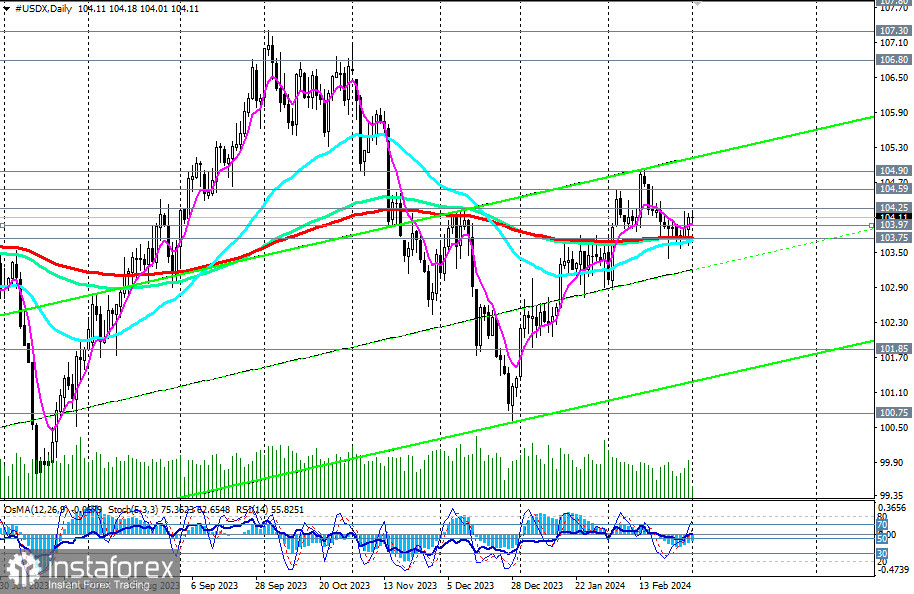
Technical indicators RSI, OsMA, and Stochastic on both daily and weekly charts also favor buyers, signaling the relevance of holding long-term and medium-term positions.
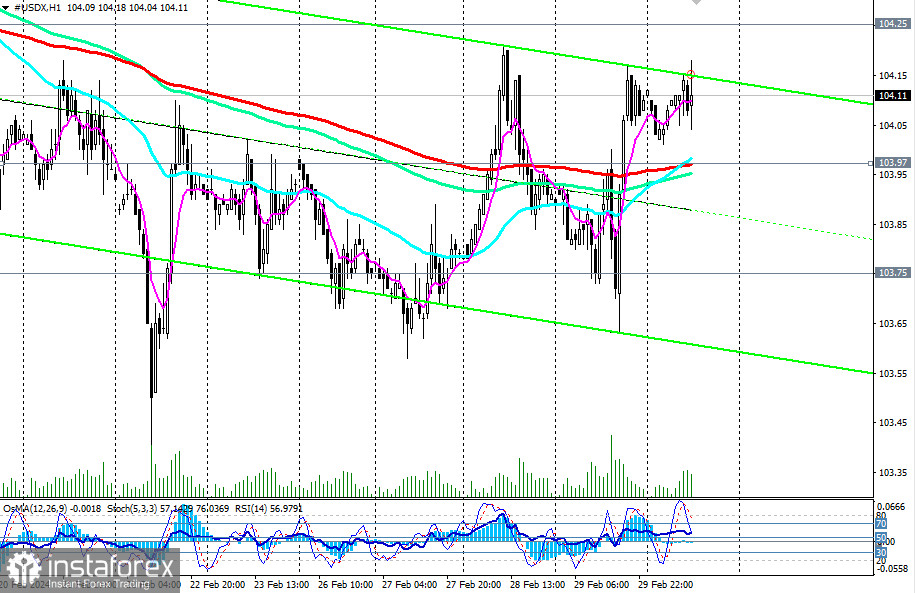
A breakthrough of the local resistance level at 104.25 could serve as the earliest signal for new purchases. The potential targets (within a 2 or 3-month interval) include the October highs and the levels of 106.50, 106.80, 107.00, 107.30, unless negative macro indicators, particularly CPI indices, begin to emerge from the U.S., altering the scenario.
In an alternative scenario, a breakthrough of the key support level at 103.75 may signal the initiation of short positions. Further decline would lead DXY into the medium-term bearish market zone, once again favoring short positions with targets at key support levels of 101.85 (144 EMA on the weekly chart), 101.00, 100.75 (200 EMA on the weekly chart), 100.00, thereby distinguishing the long-term bullish market from the bearish one.
The future dynamics of the dollar and its DXY index will be closely tied to the fundamental background and the actions of the Federal Reserve.
Support levels: 104.00, 103.97, 103.75, 103.40, 103.00, 102.00, 101.85, 101.00, 100.75, 100.00
Resistance levels: 104.25, 104.59, 104.90, 105.00, 106.00, 106.80, 107.00, 107.30
Trading Scenarios
Primary Scenario: Buy Stop at 104.30. Stop-Loss at 103.60. Targets at 104.59, 104.90, 105.00, 106.00, 106.80, 107.00, 107.30
Alternative Scenario: Sell Stop at 103.60. Stop-Loss at 104.30. Targets at 103.40, 103.00, 102.00, 101.85, 101.00, 100.75, 100.00
"Targets" correspond to support/resistance levels. This does not guarantee their achievement but can serve as a reference when planning and placing trading positions.
*The market analysis posted here is meant to increase your awareness, but not to give instructions to make a trade.
InstaSpot analytical reviews will make you fully aware of market trends! Being an InstaSpot client, you are provided with a large number of free services for efficient trading.


