


Nella nostra squadra ci sono più di 7.000.000 trader! Ogni giorno ci impegniamo a far sì che il trading migliori. Conseguiamo grandi risultati e ci muoviamo in avanti.
Il riconoscimento da parte di milioni di trader in tutto il mondo rappresenta l'alta valutazione della nostra attività! Voi avete fatto la vostra scelta e noi faremo la nostra al fine di soddisfare le vostre aspettative!
Assieme siamo una grande squadra!
InstaSpot. Siamo orgogliosi di lavorare per voi!


Attore, campione del mondo di lotta libera e semplicemente un vero maciste russo! Persona venuta dal nulla. Persona che rispecchia i nostri obiettivi. Il segreto del successo di Taktarov consiste nel mirare continuamente al suo scopo.
Dischiudi anche tu tutti gli aspetti del tuo talento! Impara, prova, sbaglia, ma non fermarti!
InstaSpot - la storia delle tue vittorie inizia qui!

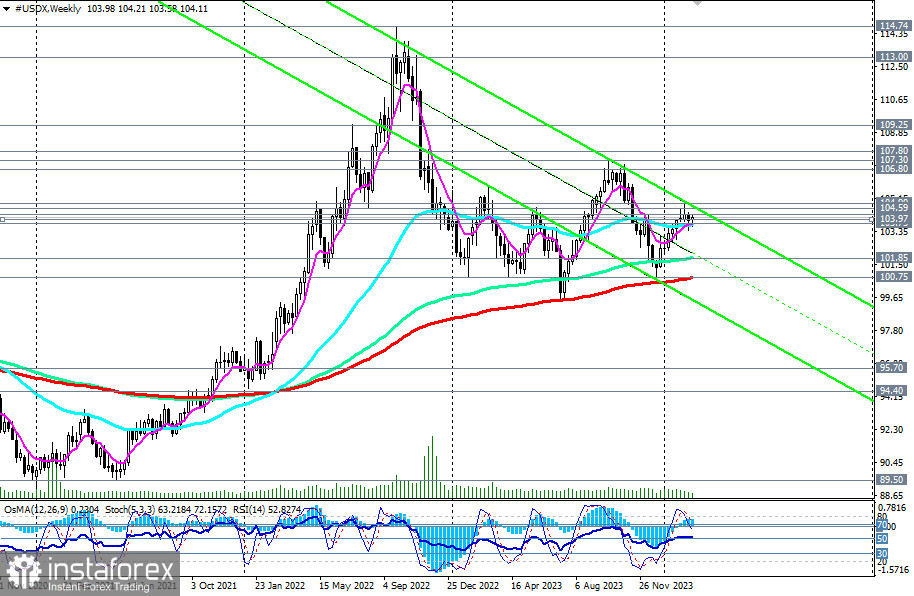
The Dollar Index (CFD #USDX on the MT4 platform) continues to trade within the zone of a long-term bullish market, notably above the key support level of 100.75 (200 EMA on the weekly chart).
Throughout the past month, DXY has predominantly operated within the realm of a medium-term bullish market, bounded by the support level of 103.75 (200 EMA on the daily chart).
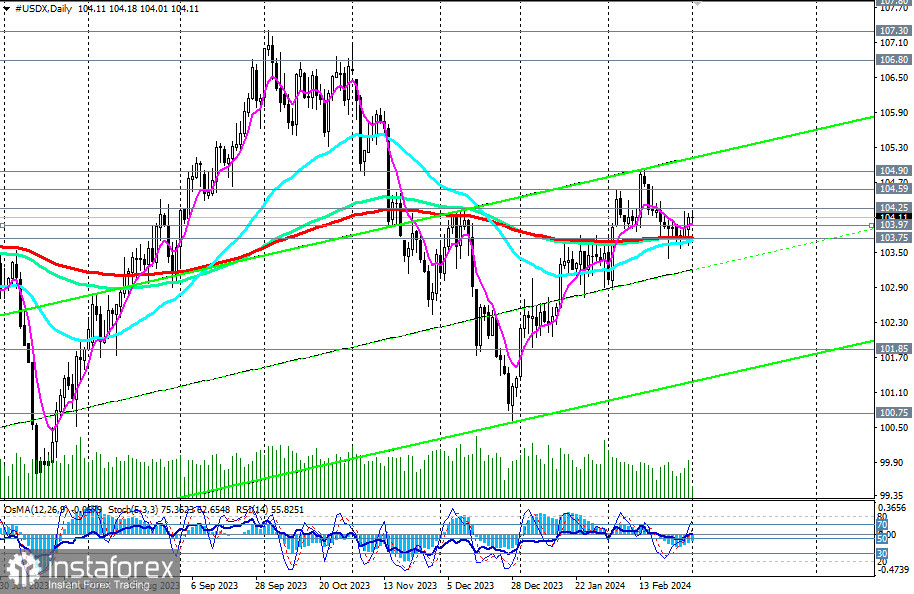
Technical indicators RSI, OsMA, and Stochastic on both daily and weekly charts also favor buyers, signaling the relevance of holding long-term and medium-term positions.
A breakthrough of the local resistance level at 104.25 could serve as the earliest signal for new purchases. The potential targets (within a 2 or 3-month interval) include the October highs and the levels of 106.50, 106.80, 107.00, 107.30, unless negative macro indicators, particularly CPI indices, begin to emerge from the U.S., altering the scenario.
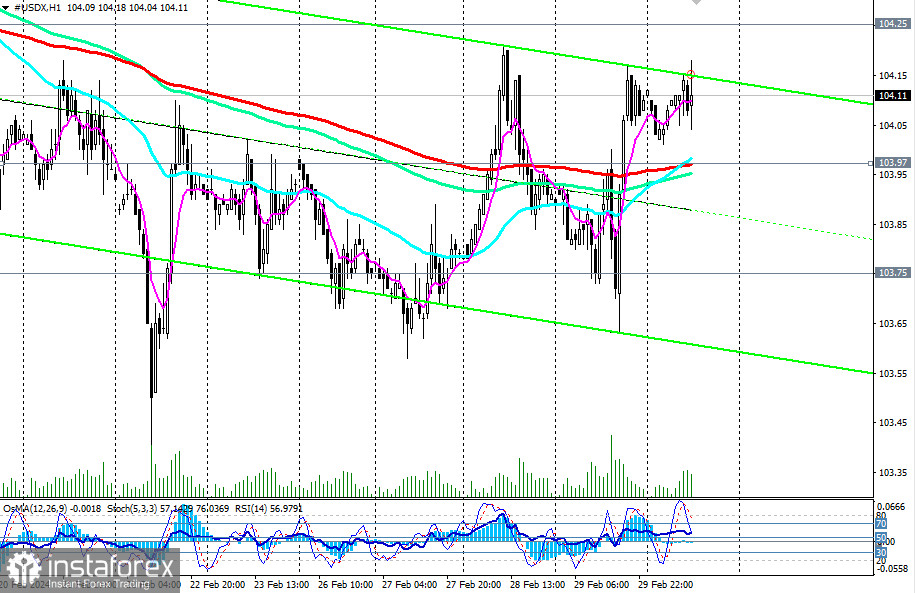
In an alternative scenario, a breakthrough of the key support level at 103.75 may signal the initiation of short positions. Further decline would lead DXY into the medium-term bearish market zone, once again favoring short positions with targets at key support levels of 101.85 (144 EMA on the weekly chart), 101.00, 100.75 (200 EMA on the weekly chart), 100.00, thereby distinguishing the long-term bullish market from the bearish one.
The future dynamics of the dollar and its DXY index will be closely tied to the fundamental background and the actions of the Federal Reserve.
Support levels: 104.00, 103.97, 103.75, 103.40, 103.00, 102.00, 101.85, 101.00, 100.75, 100.00
Resistance levels: 104.25, 104.59, 104.90, 105.00, 106.00, 106.80, 107.00, 107.30
Trading Scenarios
Primary Scenario: Buy Stop at 104.30. Stop-Loss at 103.60. Targets at 104.59, 104.90, 105.00, 106.00, 106.80, 107.00, 107.30
Alternative Scenario: Sell Stop at 103.60. Stop-Loss at 104.30. Targets at 103.40, 103.00, 102.00, 101.85, 101.00, 100.75, 100.00
"Targets" correspond to support/resistance levels. This does not guarantee their achievement but can serve as a reference when planning and placing trading positions.
*La presente analisi del mercato ha un carattere esclusivamente informativo e non rappresenta una guida per l`effettuazione di una transazione.
Le recensioni analitiche di InstaSpot ti renderanno pienamente consapevole delle tendenze del mercato! Essendo un cliente InstaSpot, ti viene fornito un gran numero di servizi gratuiti per il trading efficiente.


