


ہمارے ٹیم میں 7000000 سے ذائد تاجران شامل ہیں
ہم تجارت کی بہتری کے لئے ہر روز اکھٹے کام کرتے ہیں اور بہترین نتائج حاصل کرتے ہوئے آگے کی جانب بڑھتے ہیں
دُنیا بھر سے سے لاکھوں ہمارے بہترین کام کو سند عطاء کرتے ہیں آپ اپنا انتحاب کریں باقی ہم آپ کی توقعات پر پورا اترنے کے لئے اپنی بہترین کوشش کریں گے
ہم مل کر ایک بہترین ٹیم بناتے ہیں
انسٹا فاریکس آپ سے کام کرتے ہوئے فخر محسوس کرتا ہے


ایکٹر - یو سی ایف 6 ٹورنامنٹ چیمپین اور واقعی ہیرو
ایک فرد کے جس نے اپنا آپ منوایا ہے وہ فرد کہ جو ہماری راہ پر چلا ہے.
ٹکٹا روو کی کامیابی کا راز یہ ہے کہ وہ اپنے اہداف کی جانب مسلسل بڑھتا رہتا ہے
اپنے ہنر یا ٹیلنٹ کے تمام پہلو آشکار کررہے ہیں
پہچانیں ، کوشش کریں ، ناکام ہوں لیکن کبھی نہ رُکیں
انسٹا فاریکس آپ کی کامیابی کی کہاں یہاں سے شروع ہوتی ہے

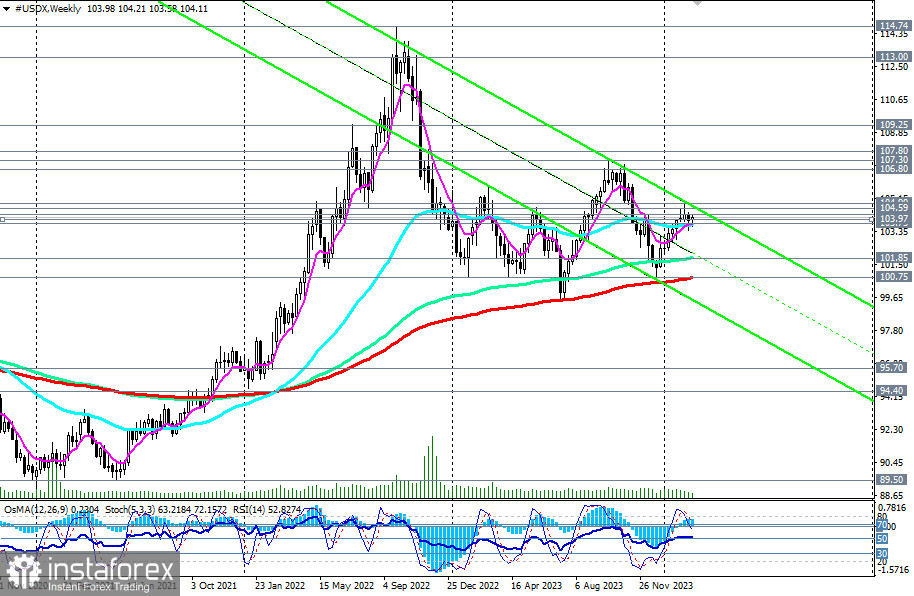
The Dollar Index (CFD #USDX on the MT4 platform) continues to trade within the zone of a long-term bullish market, notably above the key support level of 100.75 (200 EMA on the weekly chart).
Throughout the past month, DXY has predominantly operated within the realm of a medium-term bullish market, bounded by the support level of 103.75 (200 EMA on the daily chart).
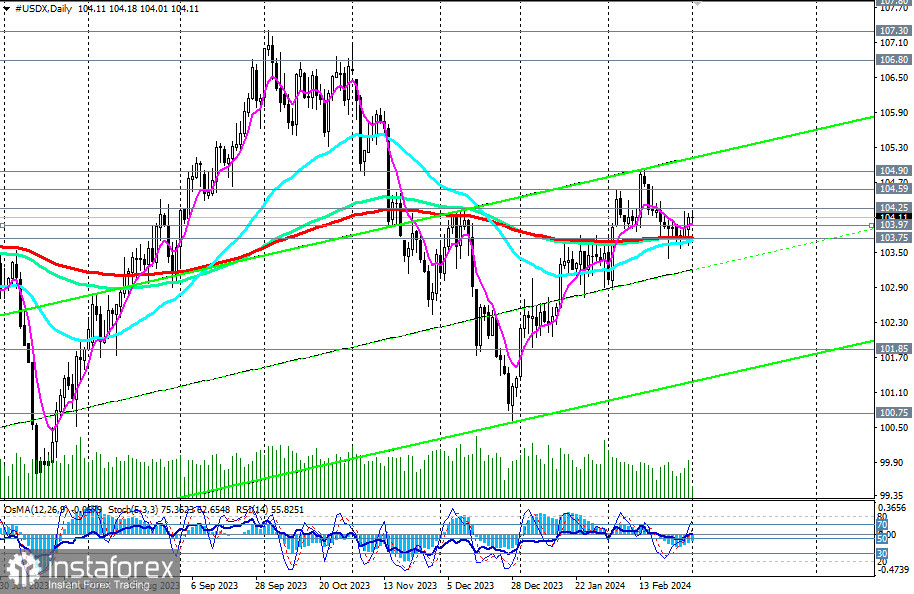
Technical indicators RSI, OsMA, and Stochastic on both daily and weekly charts also favor buyers, signaling the relevance of holding long-term and medium-term positions.
A breakthrough of the local resistance level at 104.25 could serve as the earliest signal for new purchases. The potential targets (within a 2 or 3-month interval) include the October highs and the levels of 106.50, 106.80, 107.00, 107.30, unless negative macro indicators, particularly CPI indices, begin to emerge from the U.S., altering the scenario.
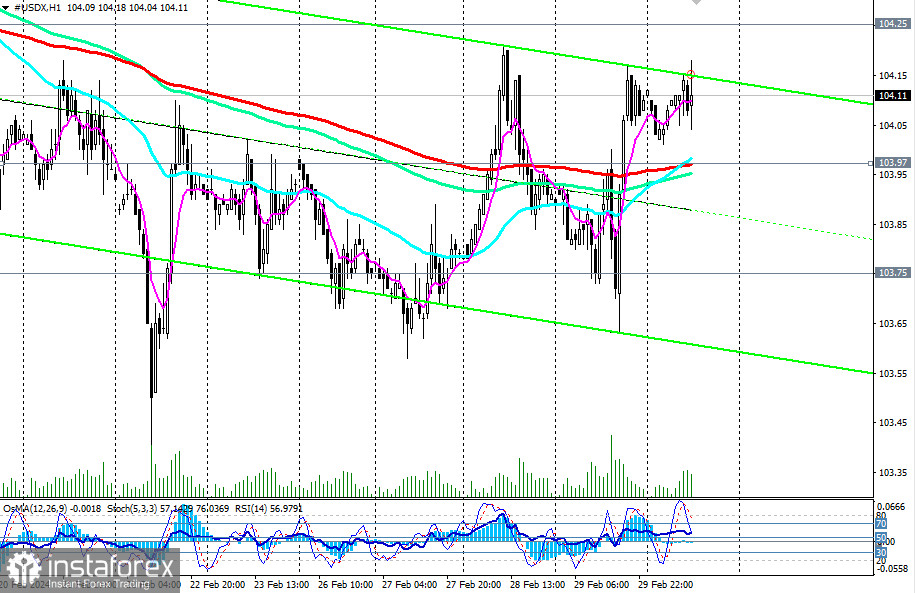
In an alternative scenario, a breakthrough of the key support level at 103.75 may signal the initiation of short positions. Further decline would lead DXY into the medium-term bearish market zone, once again favoring short positions with targets at key support levels of 101.85 (144 EMA on the weekly chart), 101.00, 100.75 (200 EMA on the weekly chart), 100.00, thereby distinguishing the long-term bullish market from the bearish one.
The future dynamics of the dollar and its DXY index will be closely tied to the fundamental background and the actions of the Federal Reserve.
Support levels: 104.00, 103.97, 103.75, 103.40, 103.00, 102.00, 101.85, 101.00, 100.75, 100.00
Resistance levels: 104.25, 104.59, 104.90, 105.00, 106.00, 106.80, 107.00, 107.30
Trading Scenarios
Primary Scenario: Buy Stop at 104.30. Stop-Loss at 103.60. Targets at 104.59, 104.90, 105.00, 106.00, 106.80, 107.00, 107.30
Alternative Scenario: Sell Stop at 103.60. Stop-Loss at 104.30. Targets at 103.40, 103.00, 102.00, 101.85, 101.00, 100.75, 100.00
"Targets" correspond to support/resistance levels. This does not guarantee their achievement but can serve as a reference when planning and placing trading positions.
*تعینات کیا مراد ہے مارکیٹ کے تجزیات یہاں ارسال کیے جاتے ہیں جس کا مقصد آپ کی بیداری بڑھانا ہے، لیکن تجارت کرنے کے لئے ہدایات دینا نہیں.
InstaSpot analytical reviews will make you fully aware of market trends! Being an InstaSpot client, you are provided with a large number of free services for efficient trading.


