


¡La leyenda en el equipo de InstaSpot!
¡Leyenda! ¿Cree que es una retórica grandilocuente? Pero, ¿cómo deberíamos llamar a un hombre, que se convirtió en el primer asiático en ganar el campeonato mundial de ajedrez júnior a los 18 años y en el primer Gran Maestro indio a los 19 años? Ese fue el comienzo de un camino difícil hacia el título de Campeón del Mundo para Viswanathan Anand, el hombre que se convirtió en parte de la historia del ajedrez para siempre. ¡Ahora una leyenda más en el equipo de InstaSpot!


Borussia es uno de los clubes de fútbol con más títulos en Alemania, que ha demostrado repetidamente a los fanáticos: el espíritu de competencia y liderazgo que ciertamente conducirán al éxito. Opere de la misma manera que los profesionales del deporte: con confianza y de forma activa. ¡Mantenga un "pase" del Borussia FC y lidere con InstaSpot!
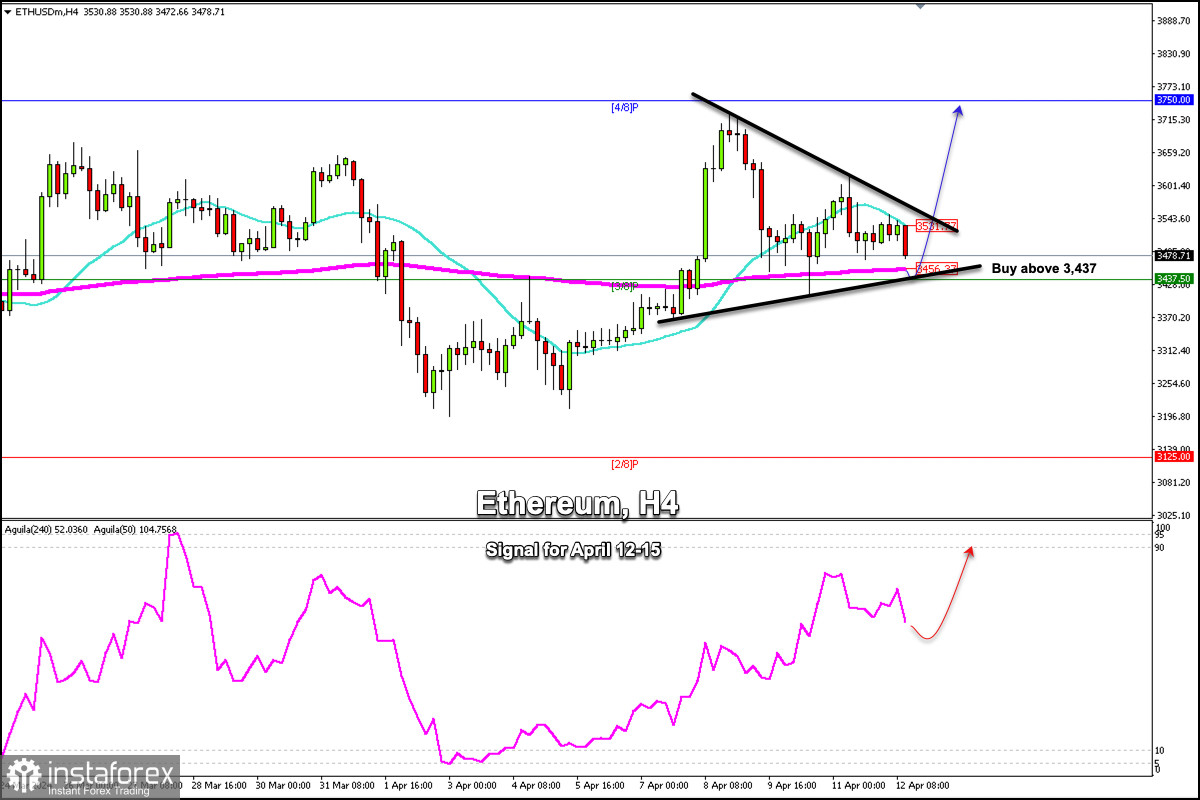
ETH/USD is trading around 3,478, having a technical correction as it is trading within the symmetrical triangle pattern. We are likely to see a further bearish movement until the token reaches the bottom of this pattern around 3,437.
Ether could trade within the symmetrical triangle pattern in the coming days until a sharp break occurs on some of the sides. A break below $3,400 could accelerate the decline towards 3,125. A bullish break above 3,540 could accelerate the bullish move and the price could reach 3,750 and even the psychological level of $4,000.
We have seen that the cryptocurrency market tends to appreciate over the weekend. Therefore, we believe that a technical bounce above 3,437 could provide an opportunity to buy with targets at 3,600 and 3,750.
We must pay close attention to this symmetrical triangle pattern to decide whether to buy or sell Ether. The Eagle indicator is giving a negative signal. It means a break below 3,400 could change the trend of ETH/USD.
*El análisis de mercado publicado aquí tiene la finalidad de incrementar su conocimiento, más no darle instrucciones para realizar una operación.
¡Los informes analíticos de InstaSpot lo mantendrá bien informado de las tendencias del mercado! Al ser un cliente de InstaSpot, se le proporciona una gran cantidad de servicios gratuitos para una operación eficiente.


