


Legenda tim InstaSpot!
Legenda! Anda pikir legenda adalah retorika yang bombastis? Lalu, bagaimana menyebut seorang pria, seorang Asia pertama yang memenangkan kejuaraan catur dunia junior pada usia 18 tahun, dan yang menjadi Grandmaster India pertama pada usia 19 tahun? Itulah awal perjalanan yang sulit dalam meraih gelar Juara Dunia bagi Viswanathan Anand, pria yang menjadi bagian dari sejarah catur untuk selamanya. Sekarang, satu lagi legenda masuk ke dalam tim InstaSpot!


Borussia merupakan salah satu klub sepakbola paling terkenal di Jerman, yang telah berulang kali membuktikan pada para penggemarnya: semangat kompetisi dan kepemimpinan pasti akan mengarah pada kesuksesan. Lakukan trading dengan cara yang sama seperti para profesional olahraga: percaya diri dan aktif. Gunakan "kunci" dari Borussia FC dan jadilah yang terdepan bersama InstaSpot!

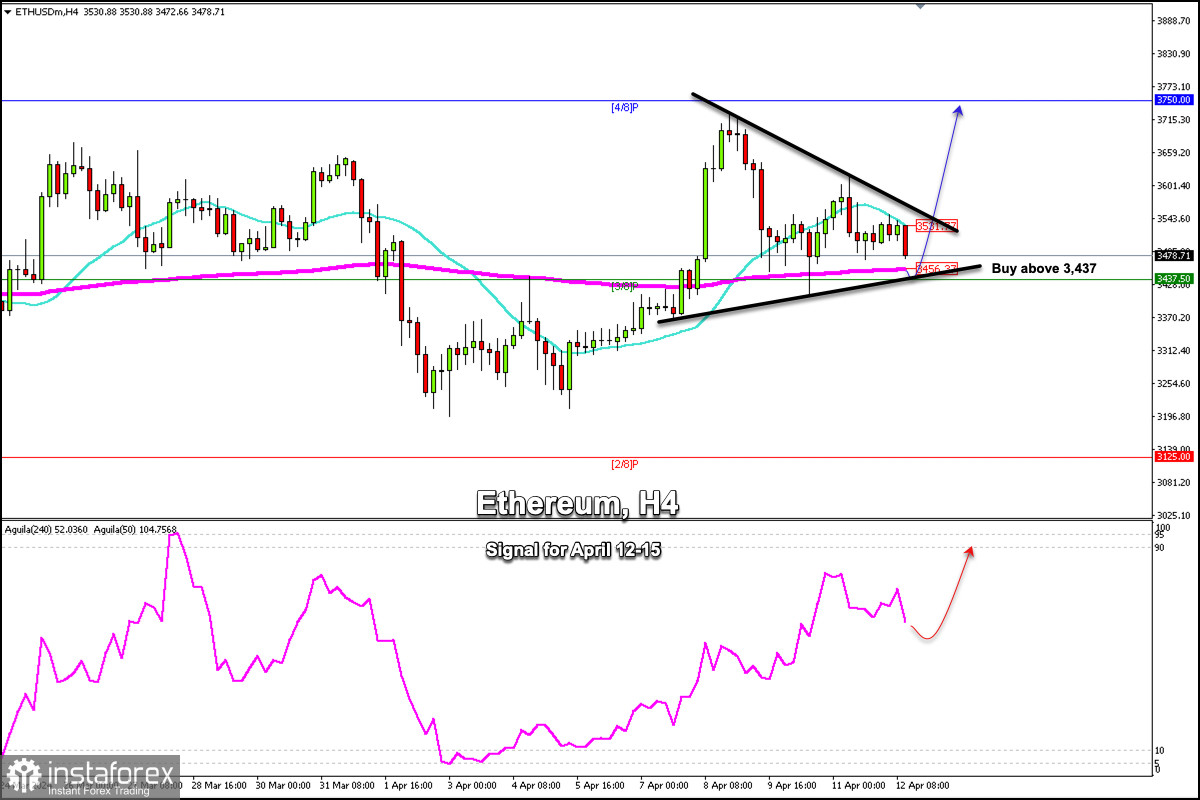
ETH/USD is trading around 3,478, having a technical correction as it is trading within the symmetrical triangle pattern. We are likely to see a further bearish movement until the token reaches the bottom of this pattern around 3,437.
Ether could trade within the symmetrical triangle pattern in the coming days until a sharp break occurs on some of the sides. A break below $3,400 could accelerate the decline towards 3,125. A bullish break above 3,540 could accelerate the bullish move and the price could reach 3,750 and even the psychological level of $4,000.
We have seen that the cryptocurrency market tends to appreciate over the weekend. Therefore, we believe that a technical bounce above 3,437 could provide an opportunity to buy with targets at 3,600 and 3,750.
We must pay close attention to this symmetrical triangle pattern to decide whether to buy or sell Ether. The Eagle indicator is giving a negative signal. It means a break below 3,400 could change the trend of ETH/USD.
*Analisis pasar yang diposting disini dimaksudkan untuk meningkatkan pengetahuan Anda namun tidak untuk memberi instruksi trading.
Tinjauan analitis InstaSpot akan membuat Anda menyadari sepenuhnya tren pasar! Sebagai klien InstaSpot, Anda dilengkapi dengan sejumlah besar layanan gratis untuk trading yang efisien.


