


Legenda dalam pasukan InstaSpot!
Legenda! Anda fikir ia adalah satu retorik yang besar? Tetapi bagaimana untuk kita memanggil seorang lelaki, yang telah menjadi pemain Asia pertama yang memenangi kejohanan catur dunia junior pada usia 18 tahun dan menjadi Grandmaster India pertama pada usia 19 tahun? Itulah permulaan yang sukar untuk merangkul gelaran Juara Dunia untuk Viswanathan Anand, seorang juara yang telah menjadi sebahagian daripada sejarah catur. Kini satu lagi legenda dalam pasukan InstaSpot!


Borussia adalah salah satu kelab bola sepak paling terkemuka di Jerman, yang telah berulang kali membuktikan kepada peminatnya: semangat persaingan dan kepemimpinan pasti akan membawa kepada kejayaan. Berdagang dengan cara yang sama seperti atlet sukan profesional beraksi menentang lawan: yakin dan aktif. Simpan "hantaran" dari Borussia FC dan menjadi pedagang hebat dengan InstaSpot!

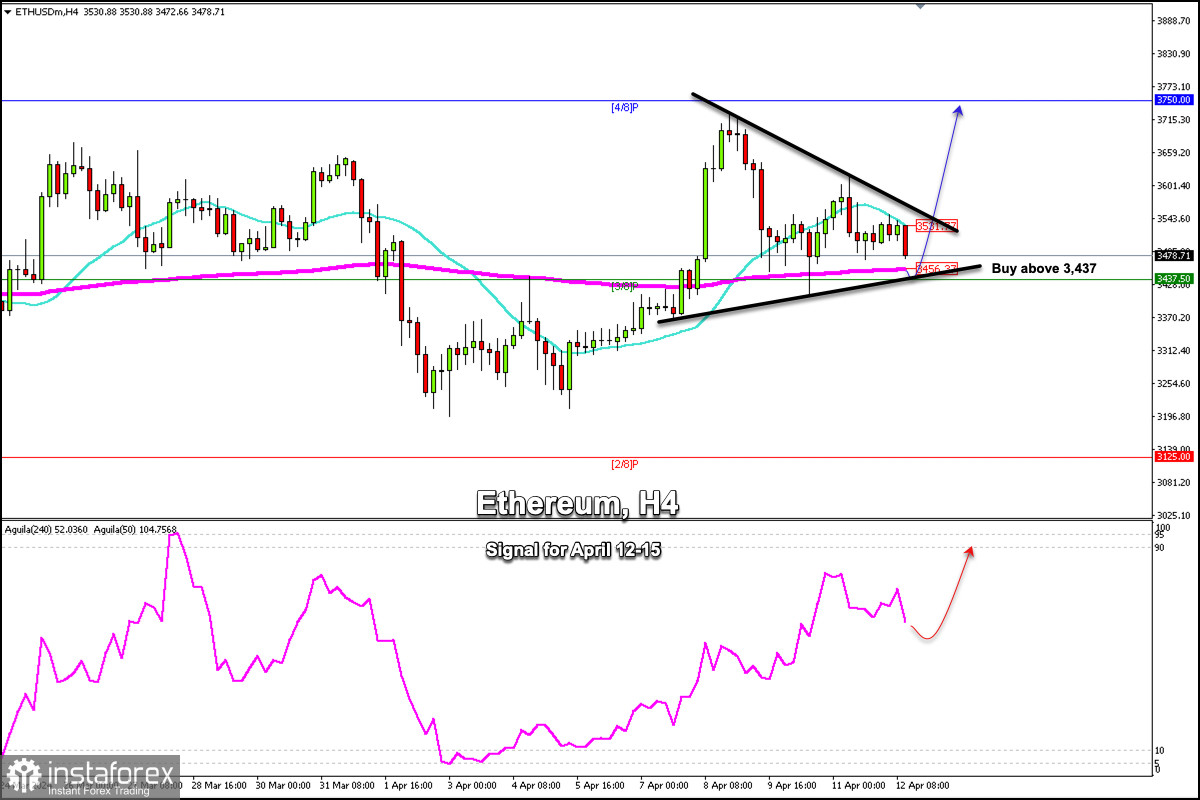
ETH/USD is trading around 3,478, having a technical correction as it is trading within the symmetrical triangle pattern. We are likely to see a further bearish movement until the token reaches the bottom of this pattern around 3,437.
Ether could trade within the symmetrical triangle pattern in the coming days until a sharp break occurs on some of the sides. A break below $3,400 could accelerate the decline towards 3,125. A bullish break above 3,540 could accelerate the bullish move and the price could reach 3,750 and even the psychological level of $4,000.
We have seen that the cryptocurrency market tends to appreciate over the weekend. Therefore, we believe that a technical bounce above 3,437 could provide an opportunity to buy with targets at 3,600 and 3,750.
We must pay close attention to this symmetrical triangle pattern to decide whether to buy or sell Ether. The Eagle indicator is giving a negative signal. It means a break below 3,400 could change the trend of ETH/USD.
* Analisis pasaran yang disiarkan di sini adalah bertujuan untuk meningkatkan kesedaran anda, tetapi tidak untuk memberi arahan untuk membuat perdagangan.
Kajian analisis InstaSpot akan membuat anda mengetahui sepenuhnya aliran pasaran! Sebagai pelanggan InstaSpot, anda disediakan sejumlah besar perkhidmatan percuma untuk dagangan yang cekap.


