


Our team has over 7,000,000 traders!
Every day we work together to improve trading. We get high results and move forward.
Recognition by millions of traders all over the world is the best appreciation of our work! You made your choice and we will do everything it takes to meet your expectations!
We are a great team together!
InstaSpot. Proud to work for you!


Actor, UFC 6 tournament champion and a true hero!
The man who made himself. The man that goes our way.
The secret behind Taktarov's success is constant movement towards the goal.
Reveal all the sides of your talent!
Discover, try, fail - but never stop!
InstaSpot. Your success story starts here!

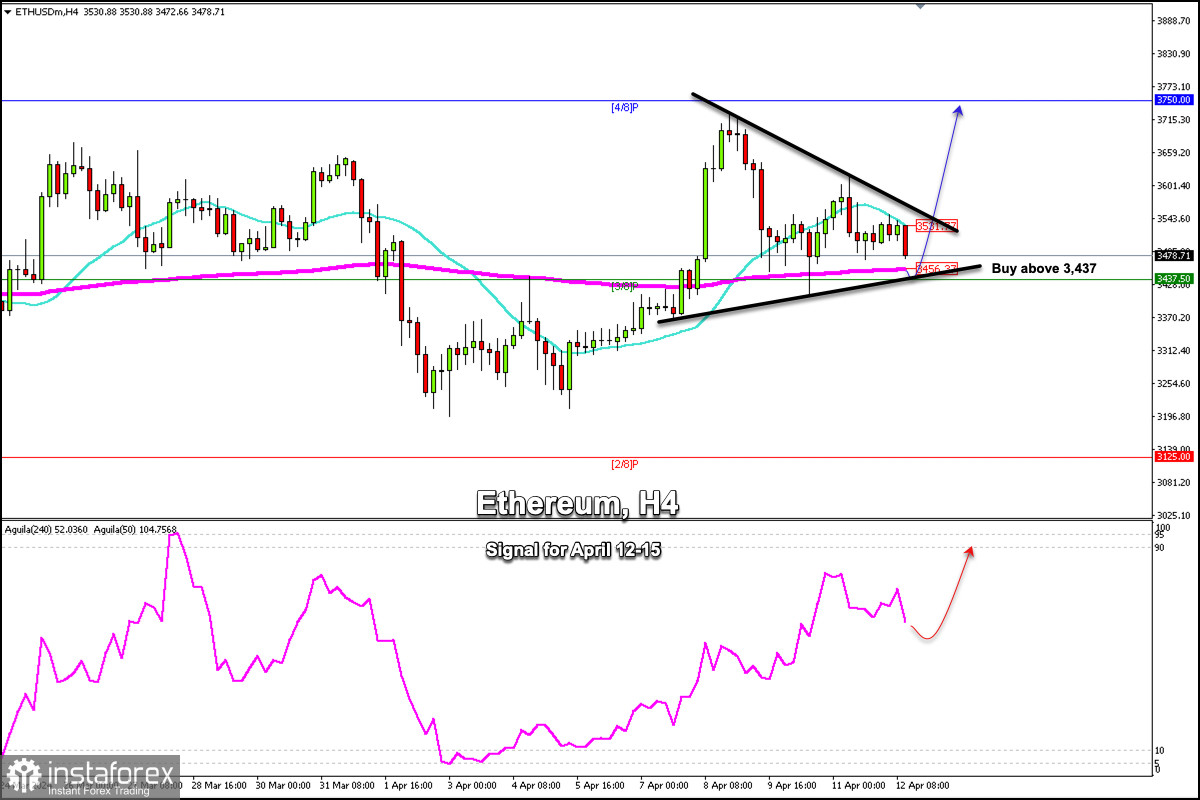
ETH/USD is trading around 3,478, having a technical correction as it is trading within the symmetrical triangle pattern. We are likely to see a further bearish movement until the token reaches the bottom of this pattern around 3,437.
Ether could trade within the symmetrical triangle pattern in the coming days until a sharp break occurs on some of the sides. A break below $3,400 could accelerate the decline towards 3,125. A bullish break above 3,540 could accelerate the bullish move and the price could reach 3,750 and even the psychological level of $4,000.
We have seen that the cryptocurrency market tends to appreciate over the weekend. Therefore, we believe that a technical bounce above 3,437 could provide an opportunity to buy with targets at 3,600 and 3,750.
We must pay close attention to this symmetrical triangle pattern to decide whether to buy or sell Ether. The Eagle indicator is giving a negative signal. It means a break below 3,400 could change the trend of ETH/USD.
*The market analysis posted here is meant to increase your awareness, but not to give instructions to make a trade.
InstaSpot analytical reviews will make you fully aware of market trends! Being an InstaSpot client, you are provided with a large number of free services for efficient trading.


