


¡Nuestro equipo cuenta con más de 7,000,000 operadores!
Cada día, trabajamos juntos para mejorar las operaciones. Obtenemos grandes resultados y seguimos adelante.
El reconocimiento de millones de operadores en todo el mundo es el mejor agradecimiento a nuestro trabajo! ¡Usted hizo su elección y haremos todo lo que esté a nuestro alcance para satisfacer sus expectativas!
¡Juntos somos un gran equipo!
InstaSpot. ¡Orgulloso de trabajar para usted!


¡Actor, 6 veces ganador del torneo UFC y un verdadero héroe!
El hombre que se hizo a sí mismo. El hombre que sigue nuestro camino.
El secreto detrás del éxito de Taktarov es el constante movimiento hacia el objetivo.
¡Revele todo los lados de su talento!
Descubra, intente, fracase, ¡pero nunca se rinda!
InstaSpot. ¡Su historia de éxito comienza aquí!
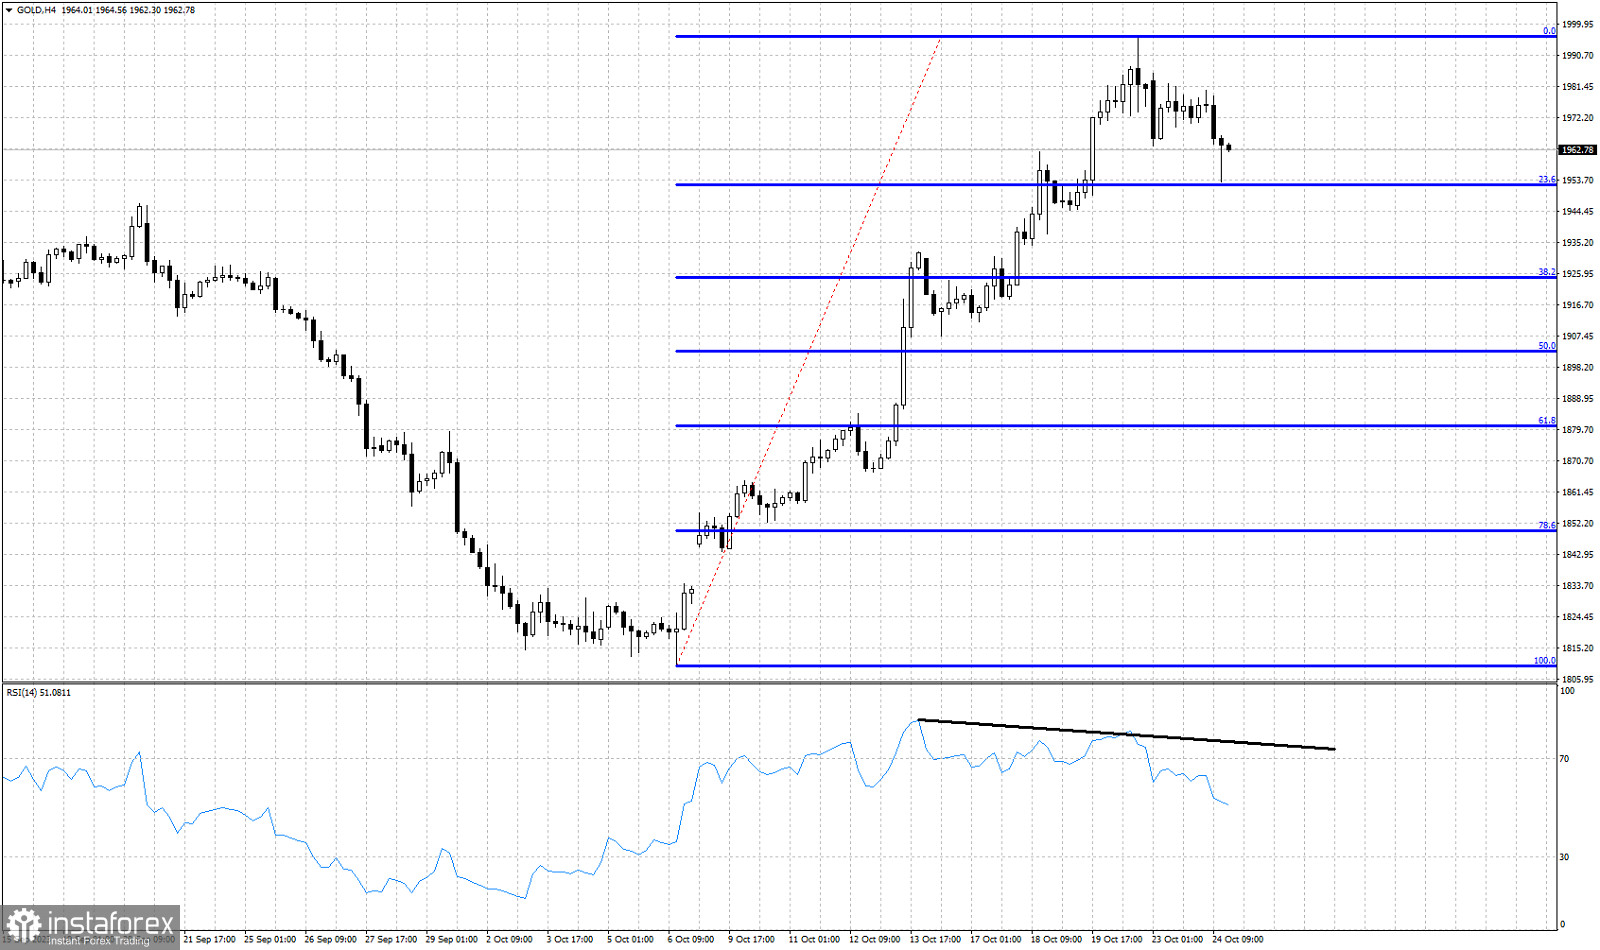
Blue lines- Fibonacci retracement levels
Black line- bearish RSI divergence
Gold price is trading around $1,964. Gold made a new lower low earlier today around $1,953 where we find the 23.6% Fibonacci retracement of the entire upward move from $1,809. Short-term trend remains bullish despite the recent pull back. This can just be a pause to the entire upward wave. However if Gold breaks below today's lows, the chances for a deeper corrective pull back will increase. Recently the RSI provided a bearish divergence signal as we mentioned in our previous post. This is not a reversal signal but only a warning. Price has started making lower lows and lower highs. Short-term resistance is found at $1,982. As long as price is below this level, Gold will remain vulnerable to more downside. A break above this level will open the way for new higher highs towards $2,000.
*El análisis de mercado publicado aquí tiene la finalidad de incrementar su conocimiento, más no darle instrucciones para realizar una operación.
¡Los informes analíticos de InstaSpot lo mantendrá bien informado de las tendencias del mercado! Al ser un cliente de InstaSpot, se le proporciona una gran cantidad de servicios gratuitos para una operación eficiente.


