


Kumpulan kami mempunyai lebih daripada 7,000,000 pedagang!
Setiap hari kami bekerjasama untuk meningkatkan perdagangan. Kami mendapat keputusan yang tinggi dan bergerak ke hadapan.
Pengiktirafan oleh berjuta-juta pedagang di seluruh dunia adalah penghargaan terbaik untuk kerja kami! Anda membuat pilihan anda dan kami akan melakukan segalanya yang diperlukan untuk memenuhi jangkaan anda!
Kami adalah kumpulan yang terbaik bersama!
InstaSpot. Berbangga bekerja untuk anda!


Pelakon, juara kejohanan UFC 6 dan seorang wira sebenar!
Lelaki yang membuat dirinya sendiri. Lelaki yang mengikut cara kami.
Rahsia di sebalik kejayaan Taktarov adalah pergerakan berterusan ke arah matlamat.
Dedahkan semua segi bakat anda!
Cari, cuba, gagal - tetapi tidak pernah berhenti!
InstaSpot. Kisah kejayaan anda bermula di sini!

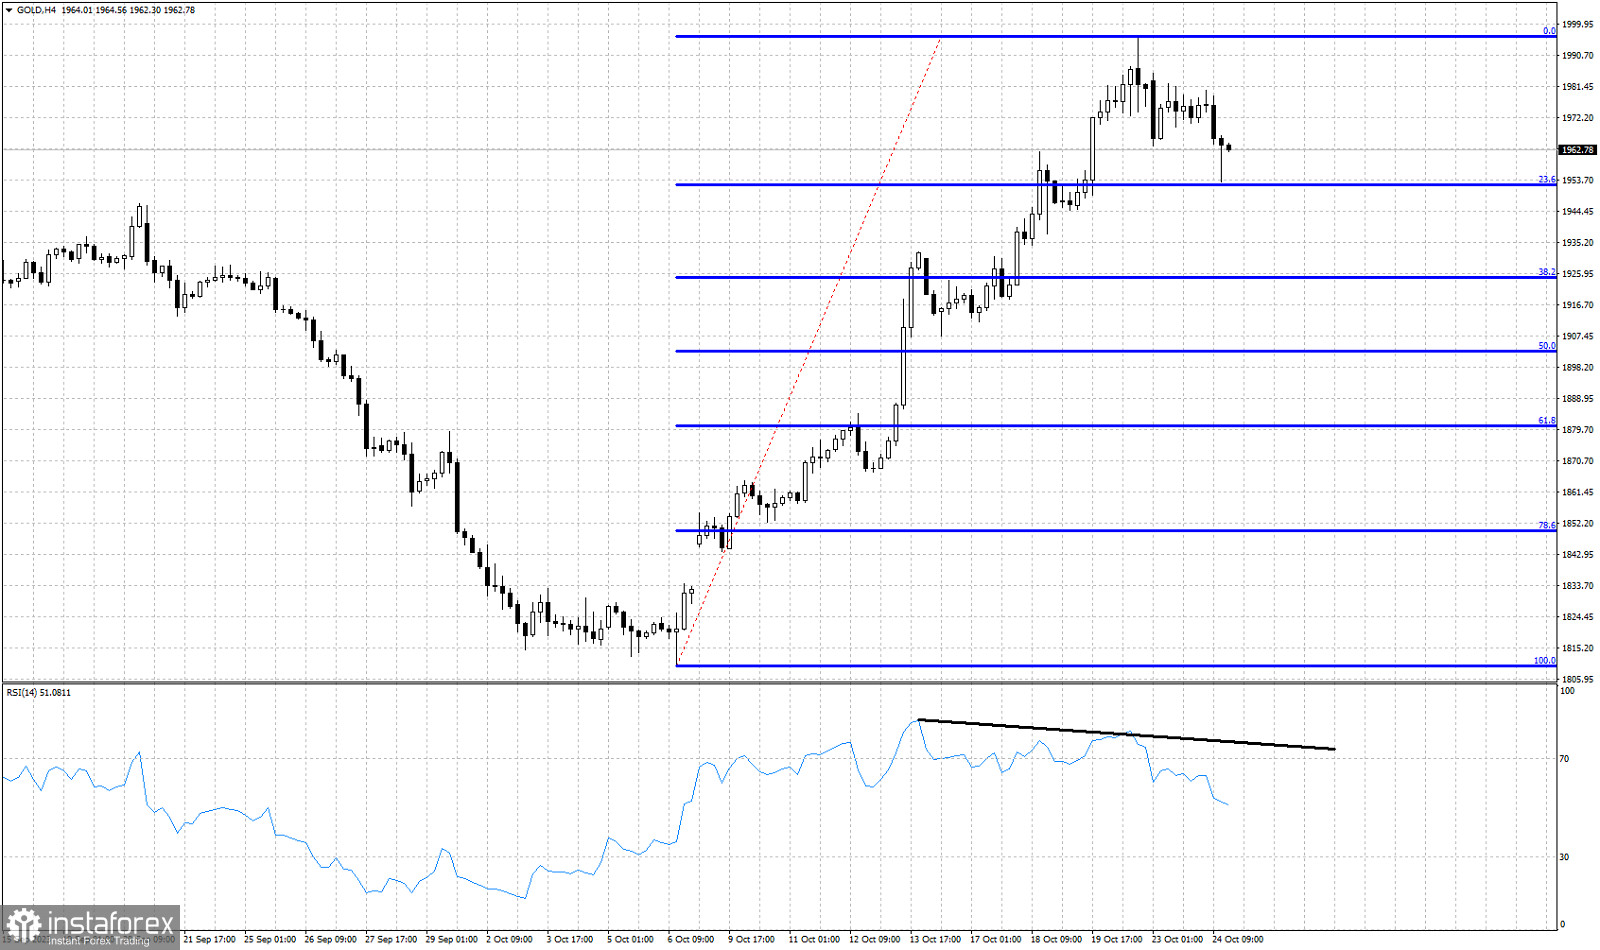
Blue lines- Fibonacci retracement levels
Black line- bearish RSI divergence
Gold price is trading around $1,964. Gold made a new lower low earlier today around $1,953 where we find the 23.6% Fibonacci retracement of the entire upward move from $1,809. Short-term trend remains bullish despite the recent pull back. This can just be a pause to the entire upward wave. However if Gold breaks below today's lows, the chances for a deeper corrective pull back will increase. Recently the RSI provided a bearish divergence signal as we mentioned in our previous post. This is not a reversal signal but only a warning. Price has started making lower lows and lower highs. Short-term resistance is found at $1,982. As long as price is below this level, Gold will remain vulnerable to more downside. A break above this level will open the way for new higher highs towards $2,000.
* Analisis pasaran yang disiarkan di sini adalah bertujuan untuk meningkatkan kesedaran anda, tetapi tidak untuk memberi arahan untuk membuat perdagangan.
Kajian analisis InstaSpot akan membuat anda mengetahui sepenuhnya aliran pasaran! Sebagai pelanggan InstaSpot, anda disediakan sejumlah besar perkhidmatan percuma untuk dagangan yang cekap.


