


La leggenda nel team InstaSpot!!
Legenda! Pensi che sia troppo patetico? Ma come dobbiamo chiamare un uomo, che è diventato il primo dell'Asia a vincere il campionato mondiale di scacchi a 18 anni e che è diventato il primo Gran Maestro indiano a 19? Fu l'inizio di un duro cammino verso il titolo di campione del mondo, l'uomo che divenne per sempre una parte della storia di scacchi. Un'altra leggenda nel team InstaSpot!


Il Borussia è una delle squadre di calcio più titolate in Germania, che ha ripetutamente dimostrato ai tifosi che lo spirito di competizione e leadership porta al successo. Fai trading nello stesso modo in cui lo fanno i professionisti dello sport - fiduciosamente e attivamente. Segui il Borussia FC e sii avanti con InstaSpot!

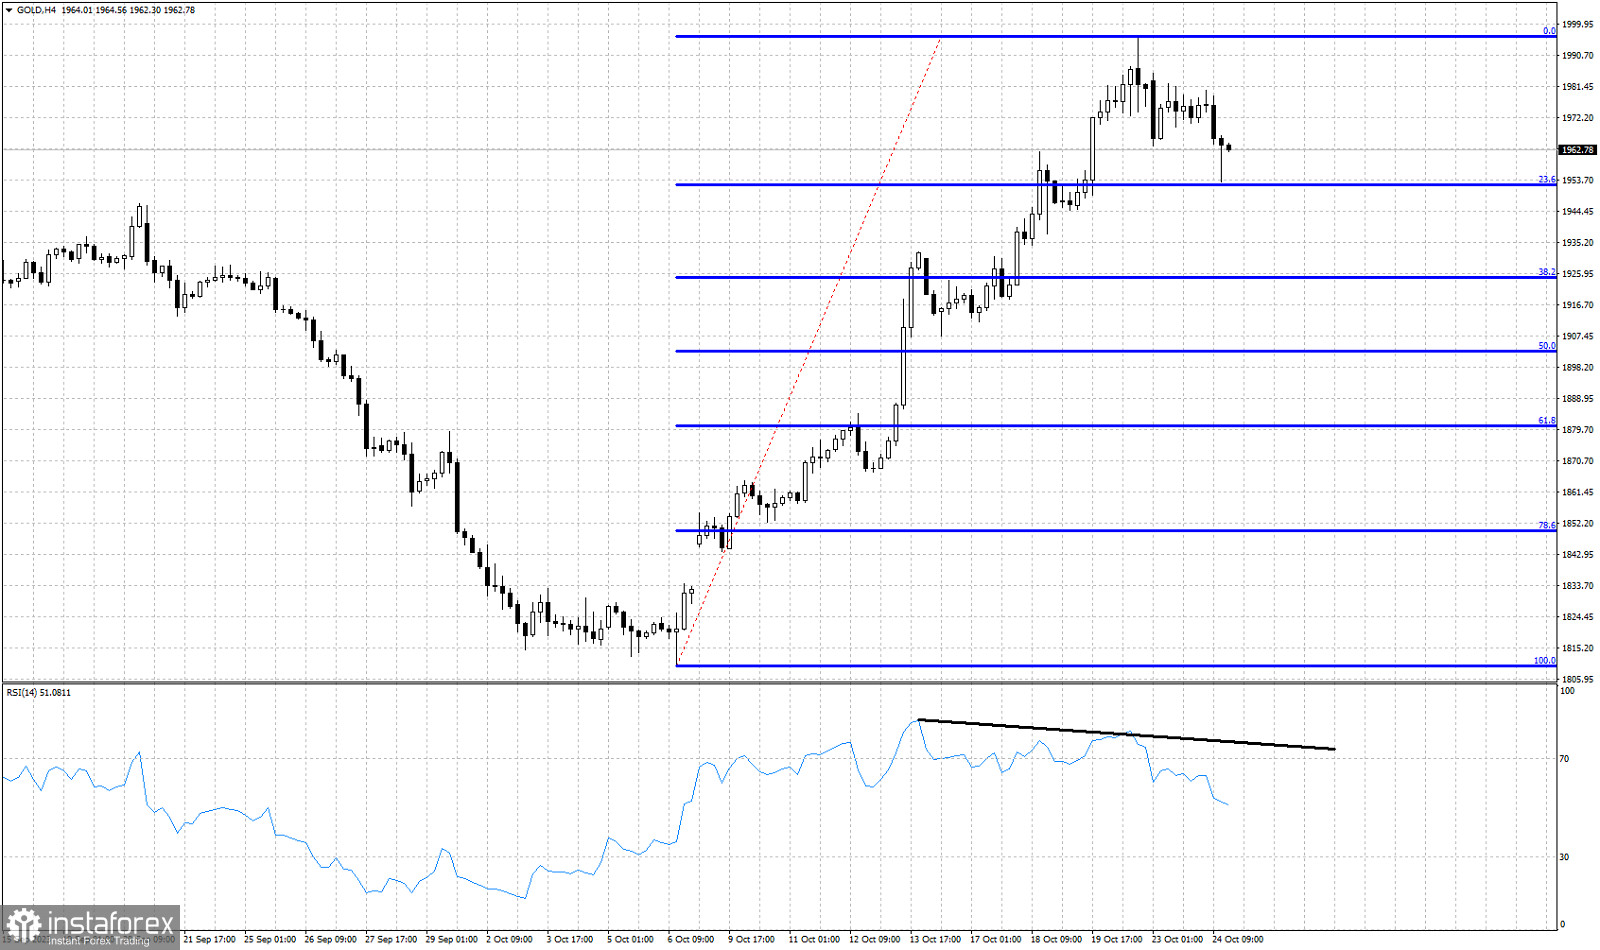
Blue lines- Fibonacci retracement levels
Black line- bearish RSI divergence
Gold price is trading around $1,964. Gold made a new lower low earlier today around $1,953 where we find the 23.6% Fibonacci retracement of the entire upward move from $1,809. Short-term trend remains bullish despite the recent pull back. This can just be a pause to the entire upward wave. However if Gold breaks below today's lows, the chances for a deeper corrective pull back will increase. Recently the RSI provided a bearish divergence signal as we mentioned in our previous post. This is not a reversal signal but only a warning. Price has started making lower lows and lower highs. Short-term resistance is found at $1,982. As long as price is below this level, Gold will remain vulnerable to more downside. A break above this level will open the way for new higher highs towards $2,000.
*La presente analisi del mercato ha un carattere esclusivamente informativo e non rappresenta una guida per l`effettuazione di una transazione.
Le recensioni analitiche di InstaSpot ti renderanno pienamente consapevole delle tendenze del mercato! Essendo un cliente InstaSpot, ti viene fornito un gran numero di servizi gratuiti per il trading efficiente.


