


The legend in the InstaSpot team!
Legend! You think that's bombastic rhetoric? But how should we call a man, who became the first Asian to win the junior world chess championship at 18 and who became the first Indian Grandmaster at 19? That was the start of a hard path to the World Champion title for Viswanathan Anand, the man who became a part of history of chess forever. Now one more legend in the InstaSpot team!


Borussia is one of the most titled football clubs in Germany, which has repeatedly proved to fans: the spirit of competition and leadership will certainly lead to success. Trade in the same way that sports professionals play the game: confidently and actively. Keep a "pass" from Borussia FC and be in the lead with InstaSpot!

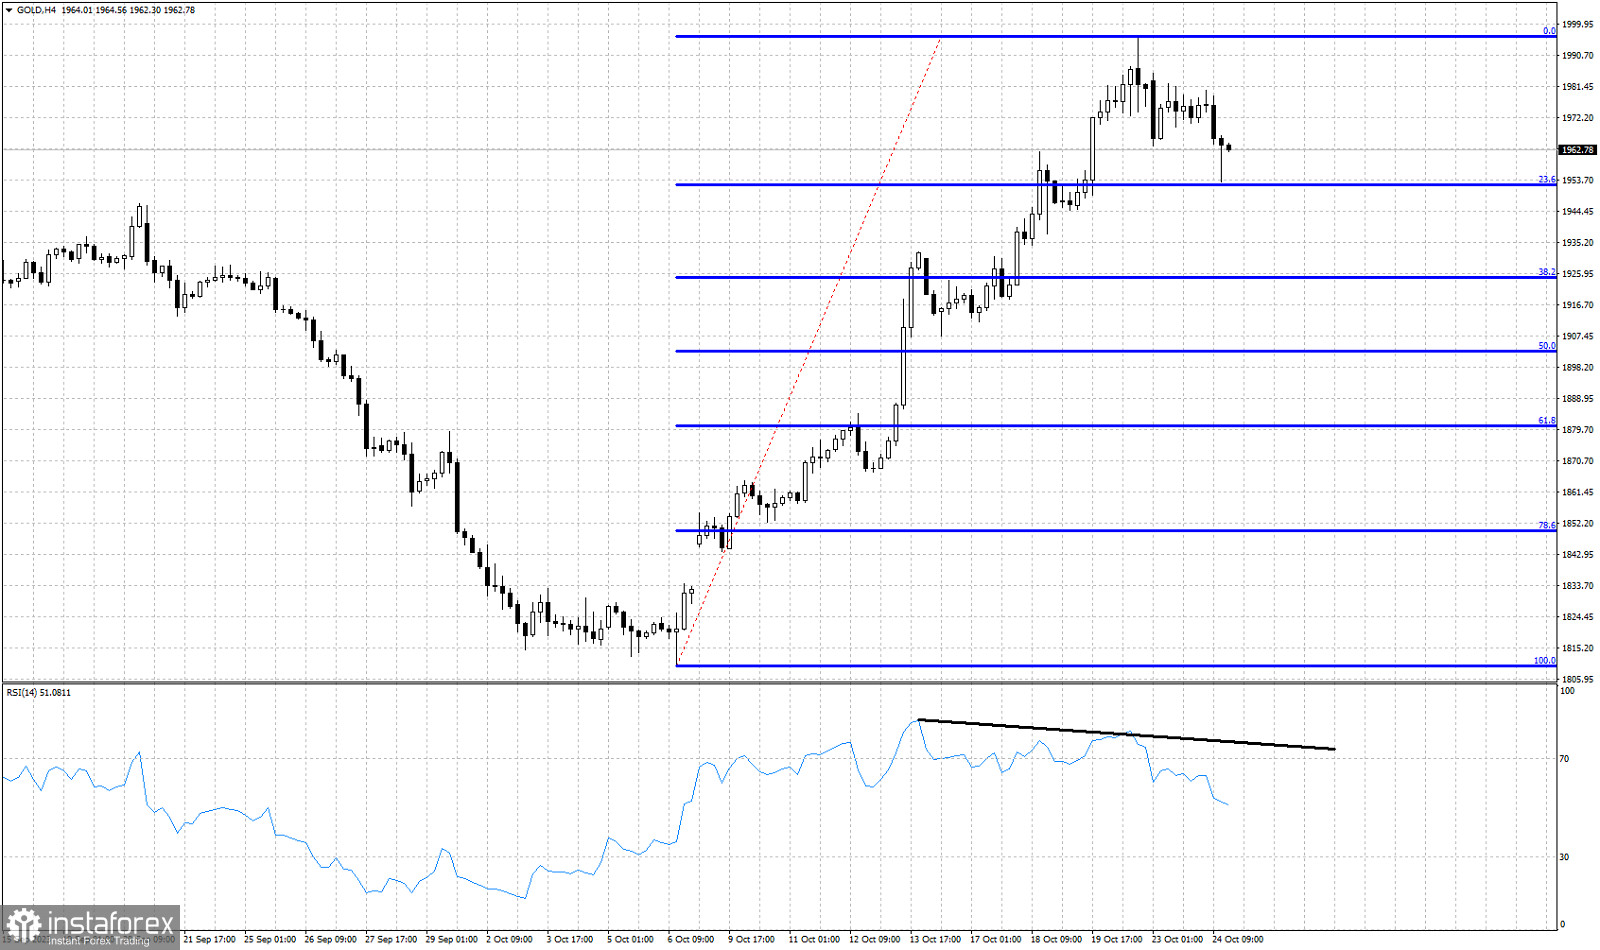
Blue lines- Fibonacci retracement levels
Black line- bearish RSI divergence
Gold price is trading around $1,964. Gold made a new lower low earlier today around $1,953 where we find the 23.6% Fibonacci retracement of the entire upward move from $1,809. Short-term trend remains bullish despite the recent pull back. This can just be a pause to the entire upward wave. However if Gold breaks below today's lows, the chances for a deeper corrective pull back will increase. Recently the RSI provided a bearish divergence signal as we mentioned in our previous post. This is not a reversal signal but only a warning. Price has started making lower lows and lower highs. Short-term resistance is found at $1,982. As long as price is below this level, Gold will remain vulnerable to more downside. A break above this level will open the way for new higher highs towards $2,000.
*এখানে পোস্ট করা মার্কেট বিশ্লেষণ আপনার সচেতনতা বৃদ্ধির জন্য প্রদান করা হয়, ট্রেড করার নির্দেশনা প্রদানের জন্য প্রদান করা হয় না।
ইন্সটাফরেক্স বিশ্লেষণমূলক পর্যালোচনাগুলো আপনাকে মার্কেট প্রবণতা সম্পর্কে পুরোপুরি সচেতন করবে! ইন্সটাফরেক্সের একজন গ্রাহক হওয়ায়, দক্ষ ট্রেডিং এর জন্য আপনাকে অনেক সেবা বিনামূল্যে প্রদান করা হয়।


