


¡Nuestro equipo cuenta con más de 7,000,000 operadores!
Cada día, trabajamos juntos para mejorar las operaciones. Obtenemos grandes resultados y seguimos adelante.
El reconocimiento de millones de operadores en todo el mundo es el mejor agradecimiento a nuestro trabajo! ¡Usted hizo su elección y haremos todo lo que esté a nuestro alcance para satisfacer sus expectativas!
¡Juntos somos un gran equipo!
InstaSpot. ¡Orgulloso de trabajar para usted!


¡Actor, 6 veces ganador del torneo UFC y un verdadero héroe!
El hombre que se hizo a sí mismo. El hombre que sigue nuestro camino.
El secreto detrás del éxito de Taktarov es el constante movimiento hacia el objetivo.
¡Revele todo los lados de su talento!
Descubra, intente, fracase, ¡pero nunca se rinda!
InstaSpot. ¡Su historia de éxito comienza aquí!
US GDP expanded less than expected in the 4 quarter. The American economy rose by 2.6%, slightly less than 3.2% in the 3 quarter. According to the US Bureau of Economic Analysis, the slower-than-previously-estimated growth reflected downward revisions to exports and consumer spending. Meanwhile, spending on services increased at a slower rate than previously estimated.
At the same time, US weekly jobless claims rose slightly more than expected, which is a negative factor for the jobs market. Continuing claims increased to 1,689,000 from 1,685,000. Initial claims soared to 198,000 from 191,000.
The greenback showed weakness after the release.
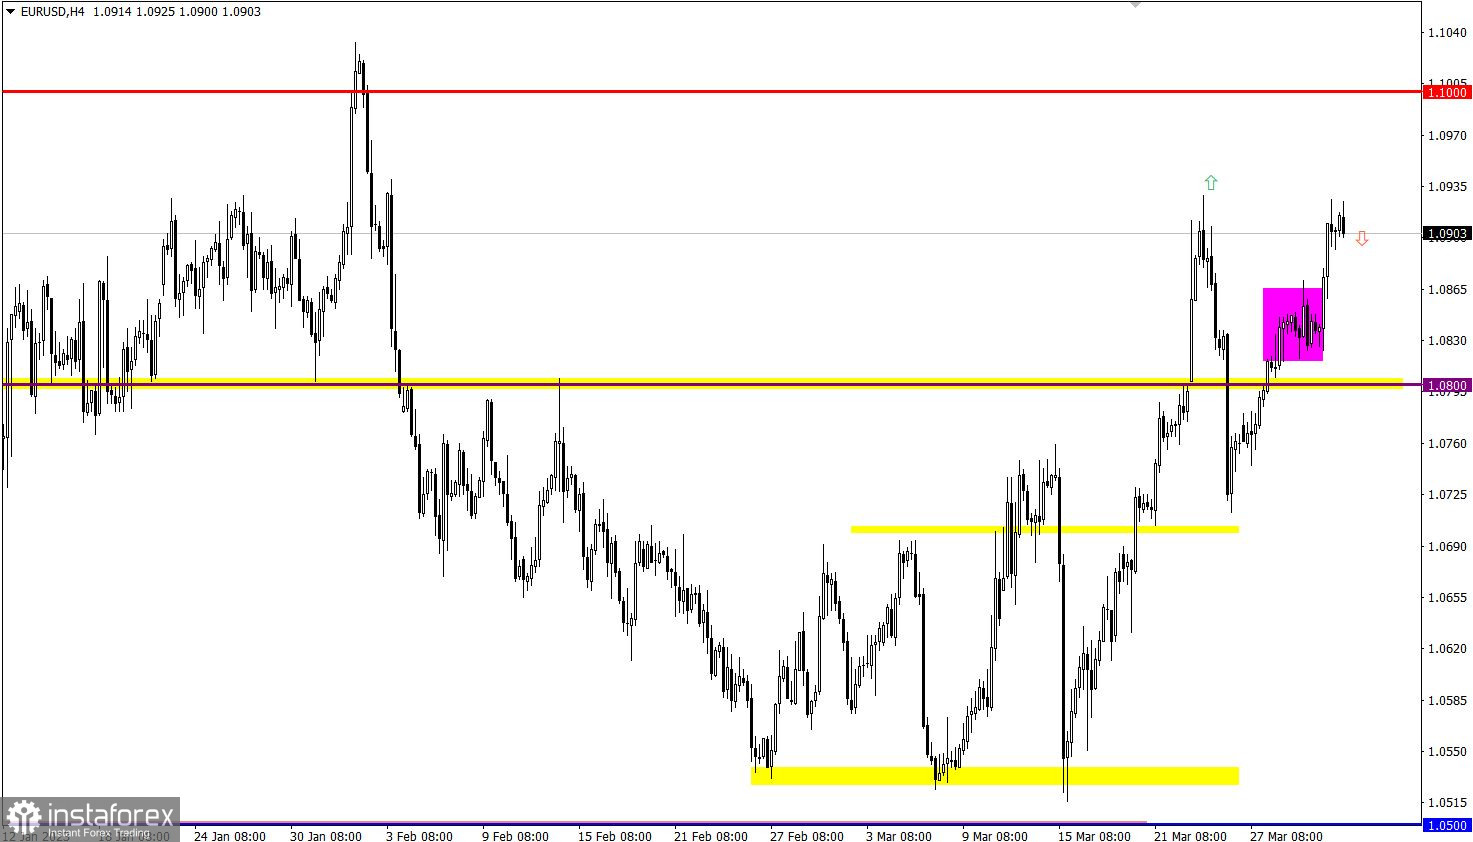
The flat market on EUR/USD ended, and the price went up. The pair recovered after the recent fall and approached the high of last week.
Moving up, GBP/USD reached the swing high of the medium-term trend, 1.2400/1.2450. Between March 9 and March 31, the pair grew by about 5% or over 600 pips.
If EUR/USD consolidates above 1.0930 and updates the high of last week, we will likely see a bullish continuation toward 1.1000. However, should the uptrend stop, the price would pull back, targeting 1.0850-1.0800.
With the pound being overbought, there is a likelihood of a decrease in buying volumes, especially if the price encounters strong resistance in the area of the swing high of the medium-term trend. A pullback may follow afterward.
However, should technical signals be ignored and the quotes consolidate above 1.2450 in the daily time frame, inertial growth would follow.

The candlestick chart shows graphical white and black rectangles with upward and downward lines. While conducting a detailed analysis of each individual candlestick, it is possible to notice its features intrinsic to a particular time frame: the opening price, the closing price, and the highest and lowest price.
Horizontal levels are price levels, in relation to which a stop or reversal of the price may occur. They are called support and resistance levels.
Circles and rectangles are highlighted examples where the price reversed in the course of its history. This color highlighting indicates horizontal lines which can exert pressure on prices in the future.
Upward/downward arrows signal a possible future price direction.
*El análisis de mercado publicado aquí tiene la finalidad de incrementar su conocimiento, más no darle instrucciones para realizar una operación.
¡Los informes analíticos de InstaSpot lo mantendrá bien informado de las tendencias del mercado! Al ser un cliente de InstaSpot, se le proporciona una gran cantidad de servicios gratuitos para una operación eficiente.


