


Nella nostra squadra ci sono più di 7.000.000 trader! Ogni giorno ci impegniamo a far sì che il trading migliori. Conseguiamo grandi risultati e ci muoviamo in avanti.
Il riconoscimento da parte di milioni di trader in tutto il mondo rappresenta l'alta valutazione della nostra attività! Voi avete fatto la vostra scelta e noi faremo la nostra al fine di soddisfare le vostre aspettative!
Assieme siamo una grande squadra!
InstaSpot. Siamo orgogliosi di lavorare per voi!


Attore, campione del mondo di lotta libera e semplicemente un vero maciste russo! Persona venuta dal nulla. Persona che rispecchia i nostri obiettivi. Il segreto del successo di Taktarov consiste nel mirare continuamente al suo scopo.
Dischiudi anche tu tutti gli aspetti del tuo talento! Impara, prova, sbaglia, ma non fermarti!
InstaSpot - la storia delle tue vittorie inizia qui!

US GDP expanded less than expected in the 4 quarter. The American economy rose by 2.6%, slightly less than 3.2% in the 3 quarter. According to the US Bureau of Economic Analysis, the slower-than-previously-estimated growth reflected downward revisions to exports and consumer spending. Meanwhile, spending on services increased at a slower rate than previously estimated.
At the same time, US weekly jobless claims rose slightly more than expected, which is a negative factor for the jobs market. Continuing claims increased to 1,689,000 from 1,685,000. Initial claims soared to 198,000 from 191,000.
The greenback showed weakness after the release.
The flat market on EUR/USD ended, and the price went up. The pair recovered after the recent fall and approached the high of last week.
Moving up, GBP/USD reached the swing high of the medium-term trend, 1.2400/1.2450. Between March 9 and March 31, the pair grew by about 5% or over 600 pips.
If EUR/USD consolidates above 1.0930 and updates the high of last week, we will likely see a bullish continuation toward 1.1000. However, should the uptrend stop, the price would pull back, targeting 1.0850-1.0800.
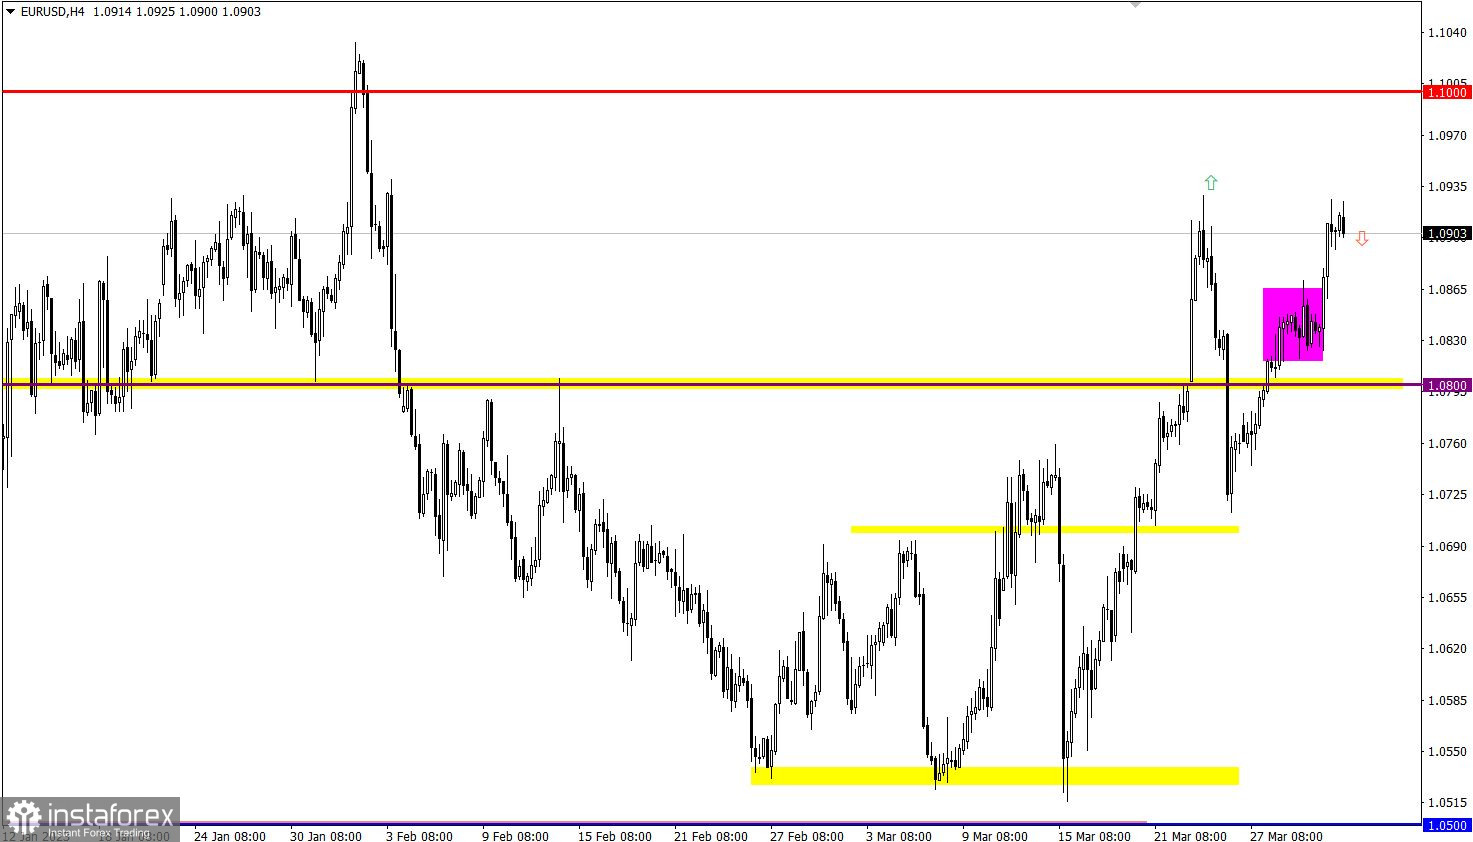
With the pound being overbought, there is a likelihood of a decrease in buying volumes, especially if the price encounters strong resistance in the area of the swing high of the medium-term trend. A pullback may follow afterward.
However, should technical signals be ignored and the quotes consolidate above 1.2450 in the daily time frame, inertial growth would follow.

The candlestick chart shows graphical white and black rectangles with upward and downward lines. While conducting a detailed analysis of each individual candlestick, it is possible to notice its features intrinsic to a particular time frame: the opening price, the closing price, and the highest and lowest price.
Horizontal levels are price levels, in relation to which a stop or reversal of the price may occur. They are called support and resistance levels.
Circles and rectangles are highlighted examples where the price reversed in the course of its history. This color highlighting indicates horizontal lines which can exert pressure on prices in the future.
Upward/downward arrows signal a possible future price direction.
*La presente analisi del mercato ha un carattere esclusivamente informativo e non rappresenta una guida per l`effettuazione di una transazione.
Le recensioni analitiche di InstaSpot ti renderanno pienamente consapevole delle tendenze del mercato! Essendo un cliente InstaSpot, ti viene fornito un gran numero di servizi gratuiti per il trading efficiente.


