


Đội ngũ của chúng tôi có hơn 7,000,000 thương nhân!
Hàng ngày chúng tôi làm việc cùng nhau để cải thiện việc giao dịch. Chúng tôi nhận được kết quả cao và luôn tiến lên phía trước.
Sự công nhận của hàng triệu thương nhân trên toàn thế giới là sự đánh giá tốt nhất cho công việc của chúng tôi! Bạn đã đưa ra quyết định của mình và chúng tôi sẽ làm mọi thứ cần thiết để đáp ứng mong đợi của bạn!
Chúng ta cùng với nhau sẽ là một nhóm tuyệt vời!
InstaSpot. Tự hào làm việc cho bạn!


Diễn viên, nhà vô địch mùa giải UFC 6 và là người hùng thật sự!
Người tự mình làm nên tất cả. Người đàn ông đáng kể học hỏi.
Bí mật đằng sau thành công của Taktarov là sự cố gắng liên tục hướng tới mục tiêu.
Hãy khai phá tất cả các mặt tài năng của bạn!
Khám phá, thử, thất bại - nhưng không bao giờ dừng lại!
InstaSpot. Câu chuyện thành công của bạn bắt đầu từ đây!
US GDP expanded less than expected in the 4 quarter. The American economy rose by 2.6%, slightly less than 3.2% in the 3 quarter. According to the US Bureau of Economic Analysis, the slower-than-previously-estimated growth reflected downward revisions to exports and consumer spending. Meanwhile, spending on services increased at a slower rate than previously estimated.
At the same time, US weekly jobless claims rose slightly more than expected, which is a negative factor for the jobs market. Continuing claims increased to 1,689,000 from 1,685,000. Initial claims soared to 198,000 from 191,000.
The greenback showed weakness after the release.
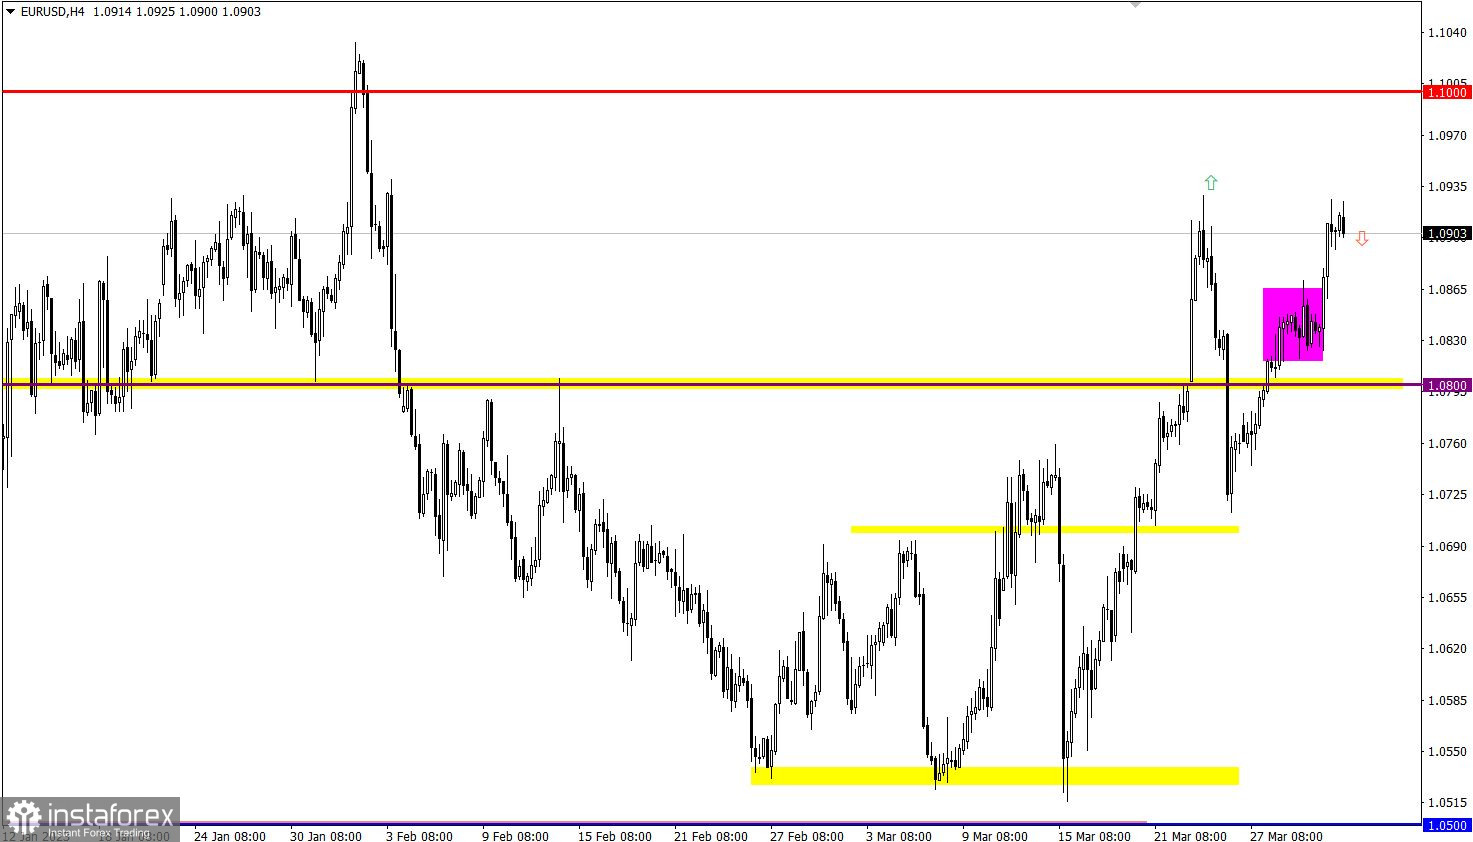
The flat market on EUR/USD ended, and the price went up. The pair recovered after the recent fall and approached the high of last week.
Moving up, GBP/USD reached the swing high of the medium-term trend, 1.2400/1.2450. Between March 9 and March 31, the pair grew by about 5% or over 600 pips.

If EUR/USD consolidates above 1.0930 and updates the high of last week, we will likely see a bullish continuation toward 1.1000. However, should the uptrend stop, the price would pull back, targeting 1.0850-1.0800.
With the pound being overbought, there is a likelihood of a decrease in buying volumes, especially if the price encounters strong resistance in the area of the swing high of the medium-term trend. A pullback may follow afterward.
However, should technical signals be ignored and the quotes consolidate above 1.2450 in the daily time frame, inertial growth would follow.

The candlestick chart shows graphical white and black rectangles with upward and downward lines. While conducting a detailed analysis of each individual candlestick, it is possible to notice its features intrinsic to a particular time frame: the opening price, the closing price, and the highest and lowest price.
Horizontal levels are price levels, in relation to which a stop or reversal of the price may occur. They are called support and resistance levels.
Circles and rectangles are highlighted examples where the price reversed in the course of its history. This color highlighting indicates horizontal lines which can exert pressure on prices in the future.
Upward/downward arrows signal a possible future price direction.
*Phân tích thị trường được đăng tải ở đây có nghĩa là để gia tăng nhận thức của bạn, nhưng không đưa ra các chỉ dẫn để thực hiện một giao dịch.
InstaSpot analytical reviews will make you fully aware of market trends! Being an InstaSpot client, you are provided with a large number of free services for efficient trading.


