


我们的团队有超过700万的操盘手!
我们每天都在一起努力改善交易。我们得到了很高的成绩,并继续前进。
世界各地数以百万计的操盘手的认可是我们工作的最大赞赏! 您做出了您的选择,我们将尽一切努力来满足您的期望!
我们是一个共同的伟大团队!
InstaSpot. 自豪地为您工作!


US GDP expanded less than expected in the 4 quarter. The American economy rose by 2.6%, slightly less than 3.2% in the 3 quarter. According to the US Bureau of Economic Analysis, the slower-than-previously-estimated growth reflected downward revisions to exports and consumer spending. Meanwhile, spending on services increased at a slower rate than previously estimated.
At the same time, US weekly jobless claims rose slightly more than expected, which is a negative factor for the jobs market. Continuing claims increased to 1,689,000 from 1,685,000. Initial claims soared to 198,000 from 191,000.
The greenback showed weakness after the release.
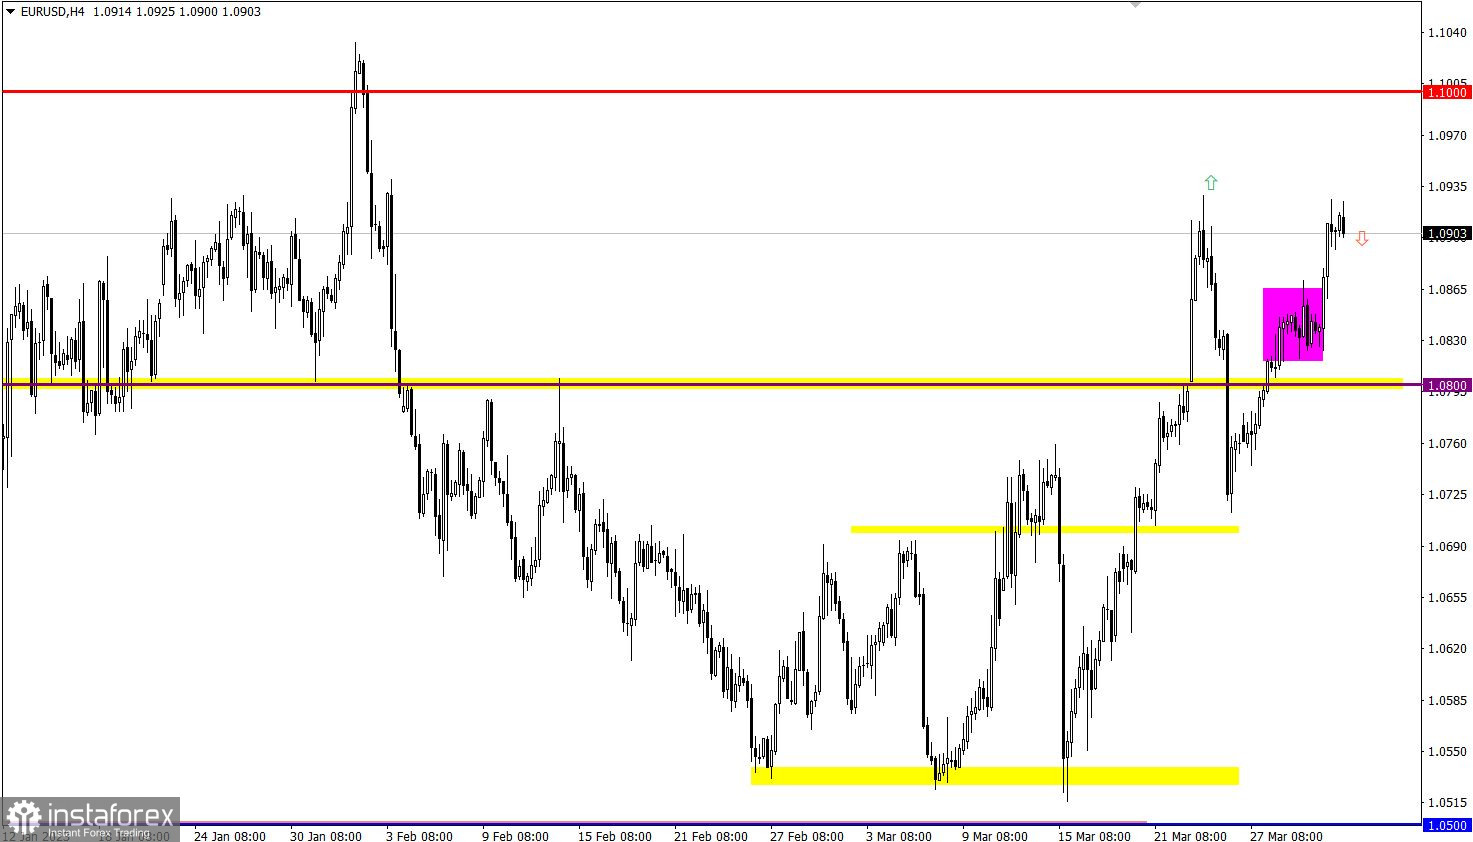
The flat market on EUR/USD ended, and the price went up. The pair recovered after the recent fall and approached the high of last week.
Moving up, GBP/USD reached the swing high of the medium-term trend, 1.2400/1.2450. Between March 9 and March 31, the pair grew by about 5% or over 600 pips.
If EUR/USD consolidates above 1.0930 and updates the high of last week, we will likely see a bullish continuation toward 1.1000. However, should the uptrend stop, the price would pull back, targeting 1.0850-1.0800.
With the pound being overbought, there is a likelihood of a decrease in buying volumes, especially if the price encounters strong resistance in the area of the swing high of the medium-term trend. A pullback may follow afterward.
However, should technical signals be ignored and the quotes consolidate above 1.2450 in the daily time frame, inertial growth would follow.

The candlestick chart shows graphical white and black rectangles with upward and downward lines. While conducting a detailed analysis of each individual candlestick, it is possible to notice its features intrinsic to a particular time frame: the opening price, the closing price, and the highest and lowest price.
Horizontal levels are price levels, in relation to which a stop or reversal of the price may occur. They are called support and resistance levels.
Circles and rectangles are highlighted examples where the price reversed in the course of its history. This color highlighting indicates horizontal lines which can exert pressure on prices in the future.
Upward/downward arrows signal a possible future price direction.
*这里的市场分析是为了增加您对市场的了解,而不是给出交易的指示。
InstaSpot分析评论将让您充分了解市场趋势! 作为InstaSpot的客户,您将获得大量的免费服务以实现有效的交易。


