


¡La leyenda en el equipo de InstaSpot!
¡Leyenda! ¿Cree que es una retórica grandilocuente? Pero, ¿cómo deberíamos llamar a un hombre, que se convirtió en el primer asiático en ganar el campeonato mundial de ajedrez júnior a los 18 años y en el primer Gran Maestro indio a los 19 años? Ese fue el comienzo de un camino difícil hacia el título de Campeón del Mundo para Viswanathan Anand, el hombre que se convirtió en parte de la historia del ajedrez para siempre. ¡Ahora una leyenda más en el equipo de InstaSpot!


Borussia es uno de los clubes de fútbol con más títulos en Alemania, que ha demostrado repetidamente a los fanáticos: el espíritu de competencia y liderazgo que ciertamente conducirán al éxito. Opere de la misma manera que los profesionales del deporte: con confianza y de forma activa. ¡Mantenga un "pase" del Borussia FC y lidere con InstaSpot!
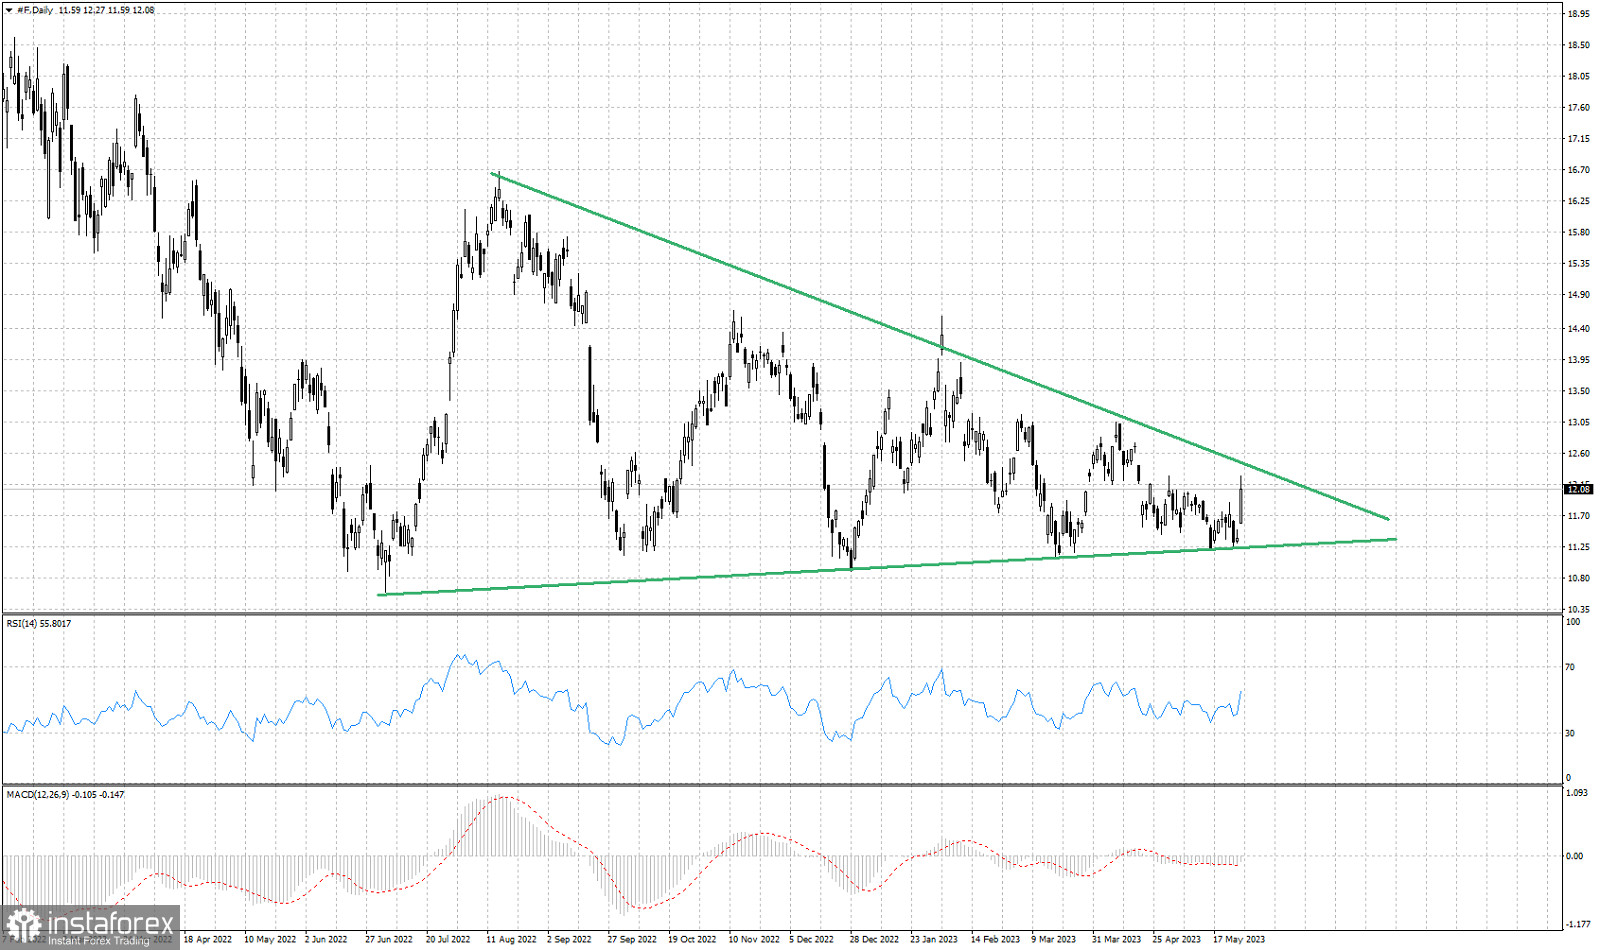
Green lines- triangle pattern
As we noted in previous analysis, the stock price of Ford was trading inside a long-term triangle pattern since June 2022. Price recently reached the lower triangle boundary where we noted the importance of support. Bulls managed to defend the support at $11.23 and provided a strong bounce bringing price to $12.08. Price is approaching the upper triangle boundary resistance at $12.43. A break above $12.10 would be a sign of strength. There is still room inside the triangle pattern for price to move, but if we see a break otut of the triangle, we should expect a strong move towards the break out direction. Traders need to be patient. Inability to break above $12-$12.10 could lead to a rejection and a bearish reversal.
*El análisis de mercado publicado aquí tiene la finalidad de incrementar su conocimiento, más no darle instrucciones para realizar una operación.
¡Los informes analíticos de InstaSpot lo mantendrá bien informado de las tendencias del mercado! Al ser un cliente de InstaSpot, se le proporciona una gran cantidad de servicios gratuitos para una operación eficiente.


