


Our team has over 7,000,000 traders!
Every day we work together to improve trading. We get high results and move forward.
Recognition by millions of traders all over the world is the best appreciation of our work! You made your choice and we will do everything it takes to meet your expectations!
We are a great team together!
InstaSpot. Proud to work for you!


Actor, UFC 6 tournament champion and a true hero!
The man who made himself. The man that goes our way.
The secret behind Taktarov's success is constant movement towards the goal.
Reveal all the sides of your talent!
Discover, try, fail - but never stop!
InstaSpot. Your success story starts here!

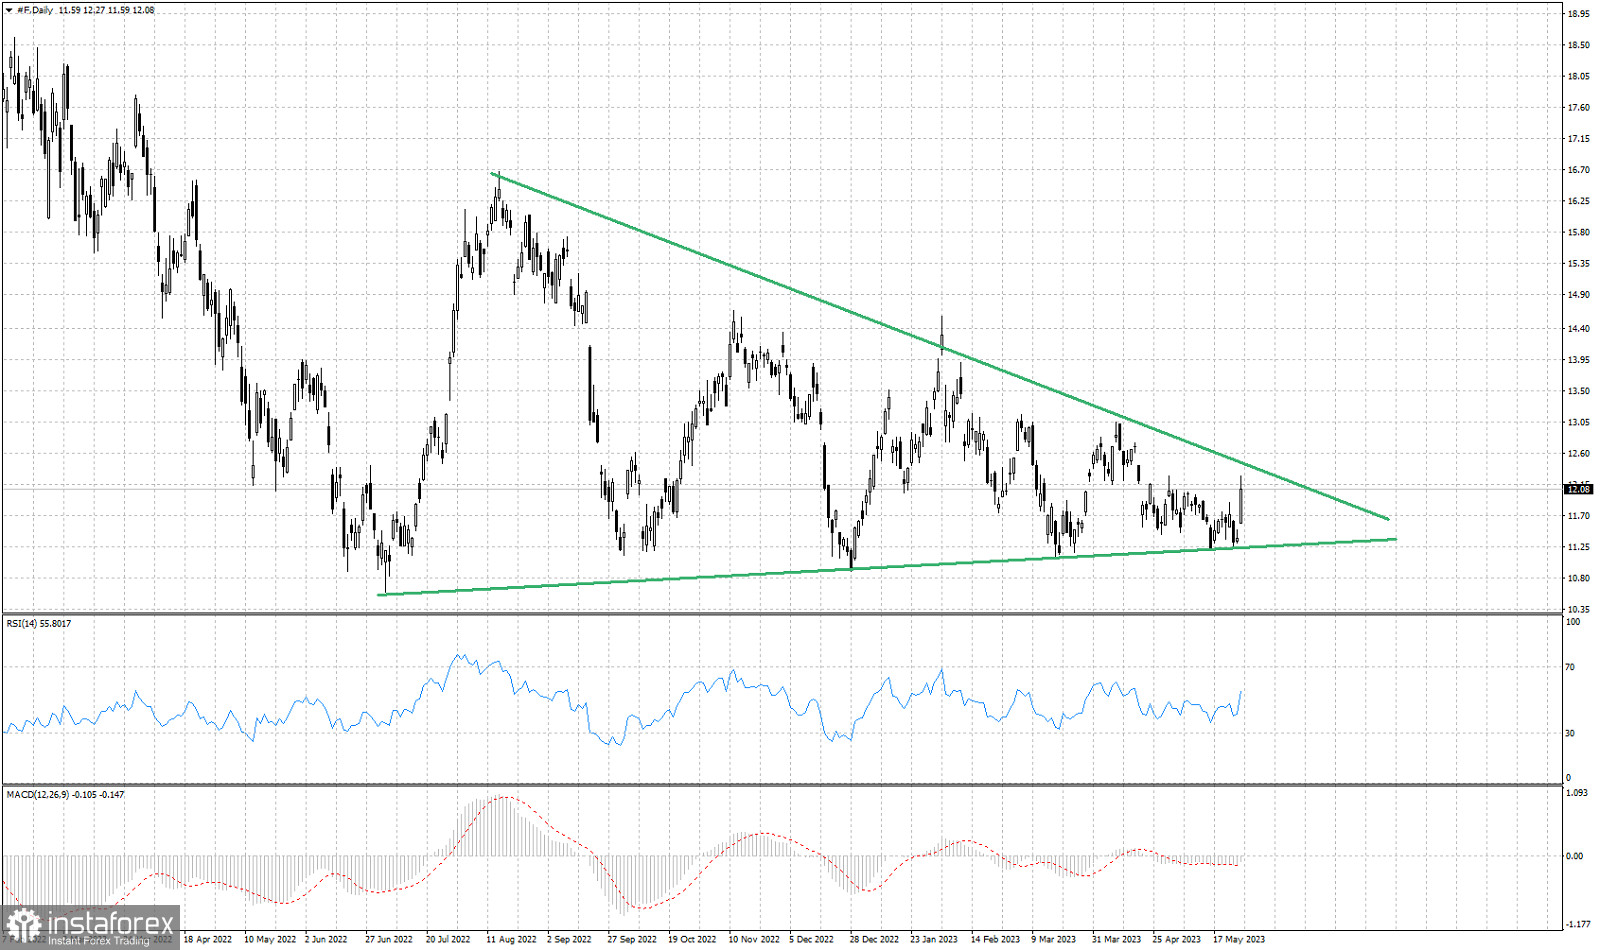
Green lines- triangle pattern
As we noted in previous analysis, the stock price of Ford was trading inside a long-term triangle pattern since June 2022. Price recently reached the lower triangle boundary where we noted the importance of support. Bulls managed to defend the support at $11.23 and provided a strong bounce bringing price to $12.08. Price is approaching the upper triangle boundary resistance at $12.43. A break above $12.10 would be a sign of strength. There is still room inside the triangle pattern for price to move, but if we see a break otut of the triangle, we should expect a strong move towards the break out direction. Traders need to be patient. Inability to break above $12-$12.10 could lead to a rejection and a bearish reversal.
*The market analysis posted here is meant to increase your awareness, but not to give instructions to make a trade.
InstaSpot analytical reviews will make you fully aware of market trends! Being an InstaSpot client, you are provided with a large number of free services for efficient trading.


