


The legend in the InstaSpot team!
Legend! You think that's bombastic rhetoric? But how should we call a man, who became the first Asian to win the junior world chess championship at 18 and who became the first Indian Grandmaster at 19? That was the start of a hard path to the World Champion title for Viswanathan Anand, the man who became a part of history of chess forever. Now one more legend in the InstaSpot team!


Borussia is one of the most titled football clubs in Germany, which has repeatedly proved to fans: the spirit of competition and leadership will certainly lead to success. Trade in the same way that sports professionals play the game: confidently and actively. Keep a "pass" from Borussia FC and be in the lead with InstaSpot!

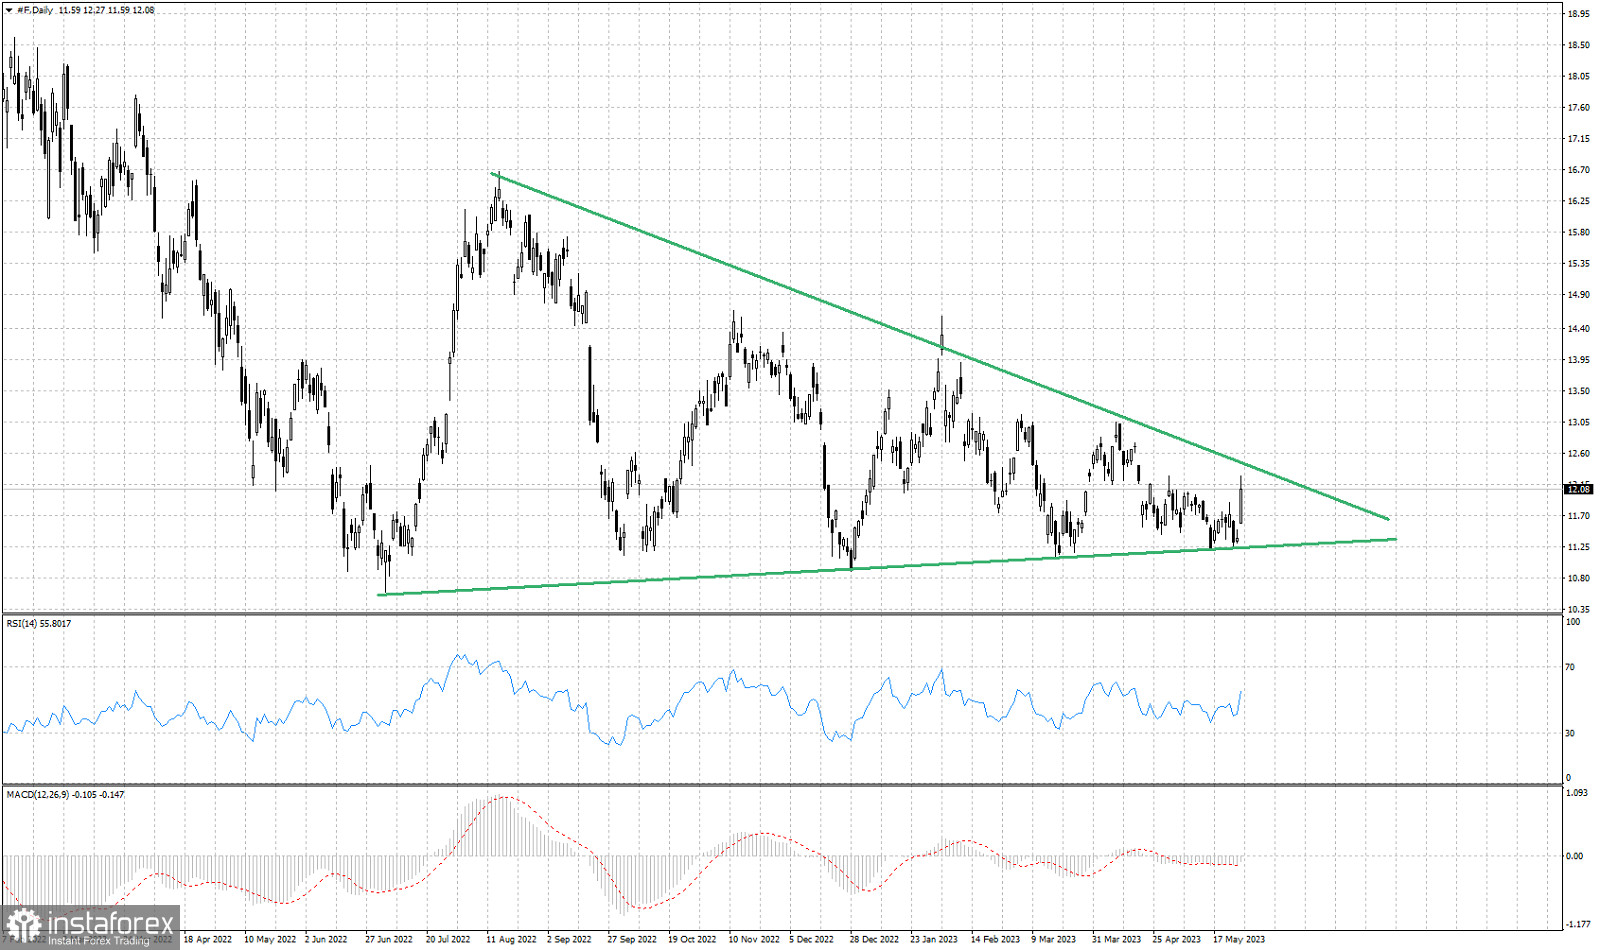
Green lines- triangle pattern
As we noted in previous analysis, the stock price of Ford was trading inside a long-term triangle pattern since June 2022. Price recently reached the lower triangle boundary where we noted the importance of support. Bulls managed to defend the support at $11.23 and provided a strong bounce bringing price to $12.08. Price is approaching the upper triangle boundary resistance at $12.43. A break above $12.10 would be a sign of strength. There is still room inside the triangle pattern for price to move, but if we see a break otut of the triangle, we should expect a strong move towards the break out direction. Traders need to be patient. Inability to break above $12-$12.10 could lead to a rejection and a bearish reversal.
*এখানে পোস্ট করা মার্কেট বিশ্লেষণ আপনার সচেতনতা বৃদ্ধির জন্য প্রদান করা হয়, ট্রেড করার নির্দেশনা প্রদানের জন্য প্রদান করা হয় না।
ইন্সটাফরেক্স বিশ্লেষণমূলক পর্যালোচনাগুলো আপনাকে মার্কেট প্রবণতা সম্পর্কে পুরোপুরি সচেতন করবে! ইন্সটাফরেক্সের একজন গ্রাহক হওয়ায়, দক্ষ ট্রেডিং এর জন্য আপনাকে অনেক সেবা বিনামূল্যে প্রদান করা হয়।


