


La leggenda nel team InstaSpot!!
Legenda! Pensi che sia troppo patetico? Ma come dobbiamo chiamare un uomo, che è diventato il primo dell'Asia a vincere il campionato mondiale di scacchi a 18 anni e che è diventato il primo Gran Maestro indiano a 19? Fu l'inizio di un duro cammino verso il titolo di campione del mondo, l'uomo che divenne per sempre una parte della storia di scacchi. Un'altra leggenda nel team InstaSpot!


Il Borussia è una delle squadre di calcio più titolate in Germania, che ha ripetutamente dimostrato ai tifosi che lo spirito di competizione e leadership porta al successo. Fai trading nello stesso modo in cui lo fanno i professionisti dello sport - fiduciosamente e attivamente. Segui il Borussia FC e sii avanti con InstaSpot!

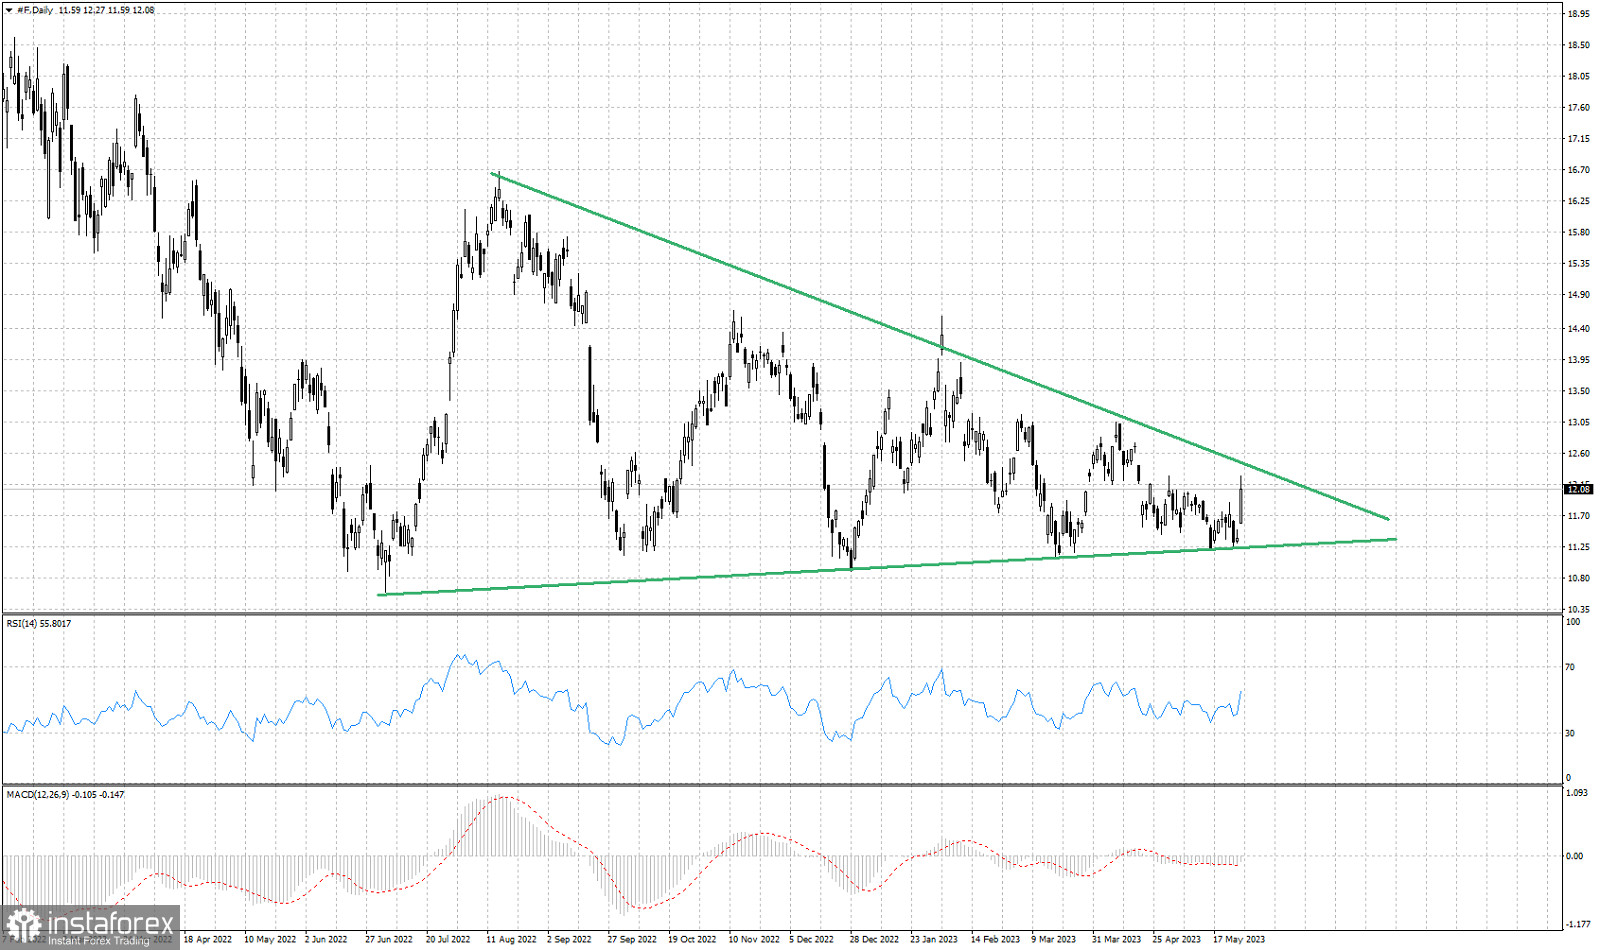
Green lines- triangle pattern
As we noted in previous analysis, the stock price of Ford was trading inside a long-term triangle pattern since June 2022. Price recently reached the lower triangle boundary where we noted the importance of support. Bulls managed to defend the support at $11.23 and provided a strong bounce bringing price to $12.08. Price is approaching the upper triangle boundary resistance at $12.43. A break above $12.10 would be a sign of strength. There is still room inside the triangle pattern for price to move, but if we see a break otut of the triangle, we should expect a strong move towards the break out direction. Traders need to be patient. Inability to break above $12-$12.10 could lead to a rejection and a bearish reversal.
*La presente analisi del mercato ha un carattere esclusivamente informativo e non rappresenta una guida per l`effettuazione di una transazione.
Le recensioni analitiche di InstaSpot ti renderanno pienamente consapevole delle tendenze del mercato! Essendo un cliente InstaSpot, ti viene fornito un gran numero di servizi gratuiti per il trading efficiente.


