


¡La leyenda en el equipo de InstaSpot!
¡Leyenda! ¿Cree que es una retórica grandilocuente? Pero, ¿cómo deberíamos llamar a un hombre, que se convirtió en el primer asiático en ganar el campeonato mundial de ajedrez júnior a los 18 años y en el primer Gran Maestro indio a los 19 años? Ese fue el comienzo de un camino difícil hacia el título de Campeón del Mundo para Viswanathan Anand, el hombre que se convirtió en parte de la historia del ajedrez para siempre. ¡Ahora una leyenda más en el equipo de InstaSpot!


Borussia es uno de los clubes de fútbol con más títulos en Alemania, que ha demostrado repetidamente a los fanáticos: el espíritu de competencia y liderazgo que ciertamente conducirán al éxito. Opere de la misma manera que los profesionales del deporte: con confianza y de forma activa. ¡Mantenga un "pase" del Borussia FC y lidere con InstaSpot!
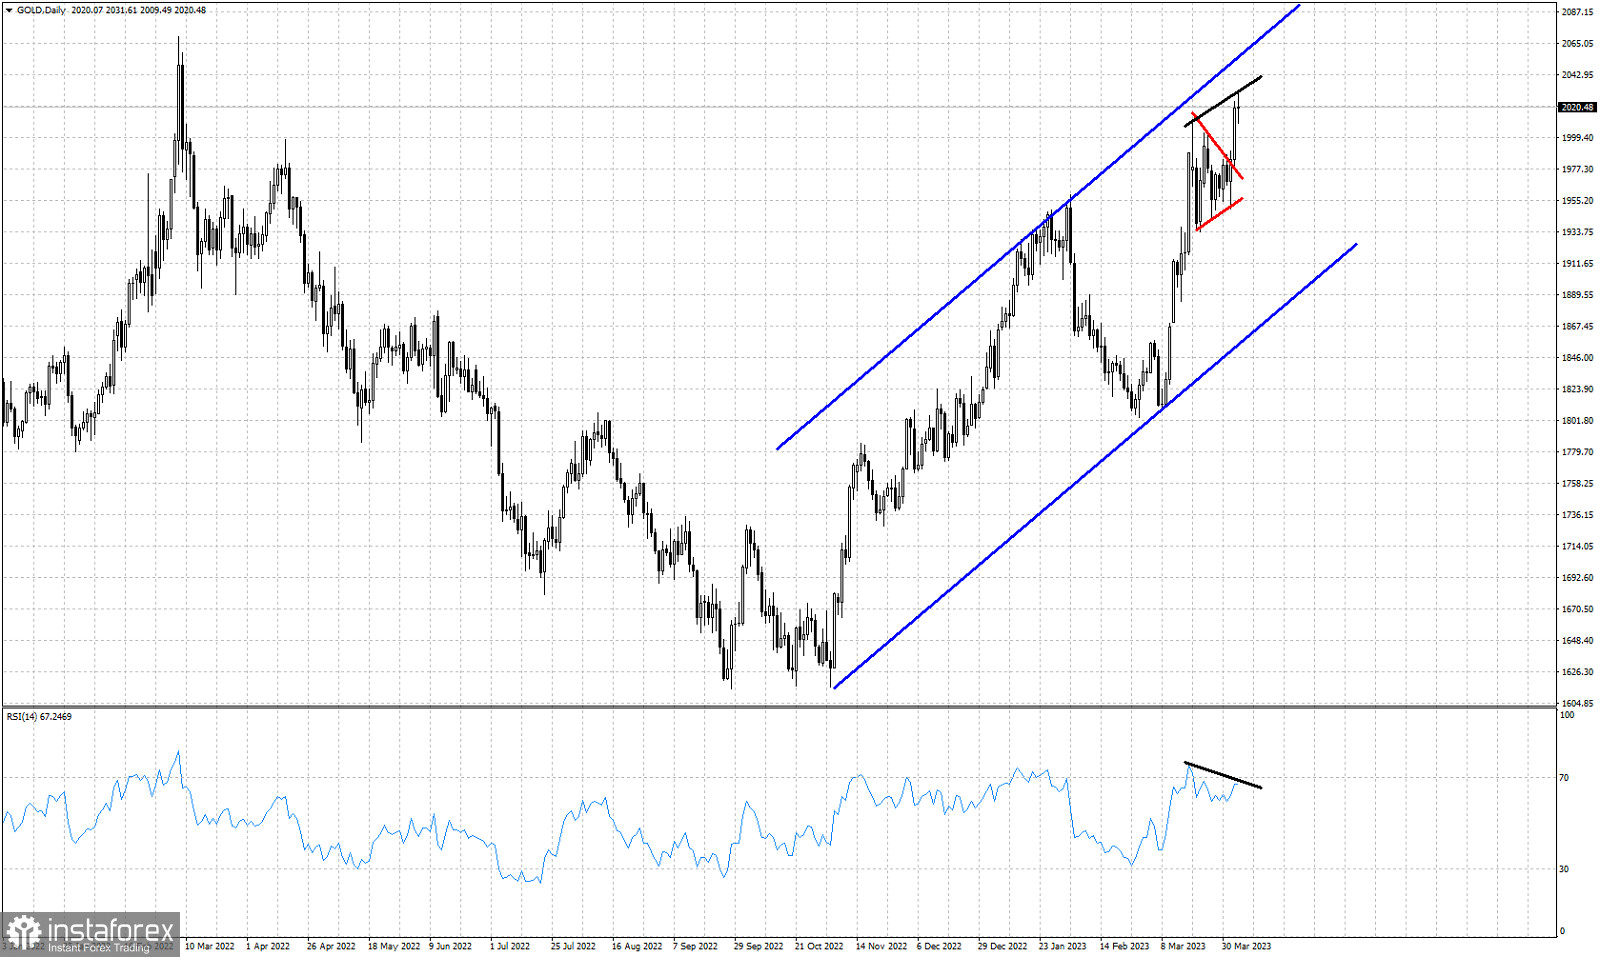
Blue lines- bullish channel
Red lines- triangle pattern (broken upwards)
Black lines- bearish RSI divergence
Gold price is trading around $2,020. Short-term trend is bullish as price continues trading inside the upward sloping blue channel since October of 2022. Price has broken out of the triangle pattern providing a new bullish signal. Our target as we mentioned in previous posts was around $2,050-60. So far price has bounced as high as $2,031.Despite the new higher high in price, the RSI did not follow. The RSI has provided a bearish divergence. This is only a warning and not a reversal signal. Support is found at the base of the triangle pattern around $1,981. Holding above this level is key for the short-term trend. I believe we are at the final stages of the upward move that started back in October 2022. Upside potential is towards $2,050-60. Downside potential of a pull back is towards $1.880.
*El análisis de mercado publicado aquí tiene la finalidad de incrementar su conocimiento, más no darle instrucciones para realizar una operación.
¡Los informes analíticos de InstaSpot lo mantendrá bien informado de las tendencias del mercado! Al ser un cliente de InstaSpot, se le proporciona una gran cantidad de servicios gratuitos para una operación eficiente.


