


Nella nostra squadra ci sono più di 7.000.000 trader! Ogni giorno ci impegniamo a far sì che il trading migliori. Conseguiamo grandi risultati e ci muoviamo in avanti.
Il riconoscimento da parte di milioni di trader in tutto il mondo rappresenta l'alta valutazione della nostra attività! Voi avete fatto la vostra scelta e noi faremo la nostra al fine di soddisfare le vostre aspettative!
Assieme siamo una grande squadra!
InstaSpot. Siamo orgogliosi di lavorare per voi!


Attore, campione del mondo di lotta libera e semplicemente un vero maciste russo! Persona venuta dal nulla. Persona che rispecchia i nostri obiettivi. Il segreto del successo di Taktarov consiste nel mirare continuamente al suo scopo.
Dischiudi anche tu tutti gli aspetti del tuo talento! Impara, prova, sbaglia, ma non fermarti!
InstaSpot - la storia delle tue vittorie inizia qui!

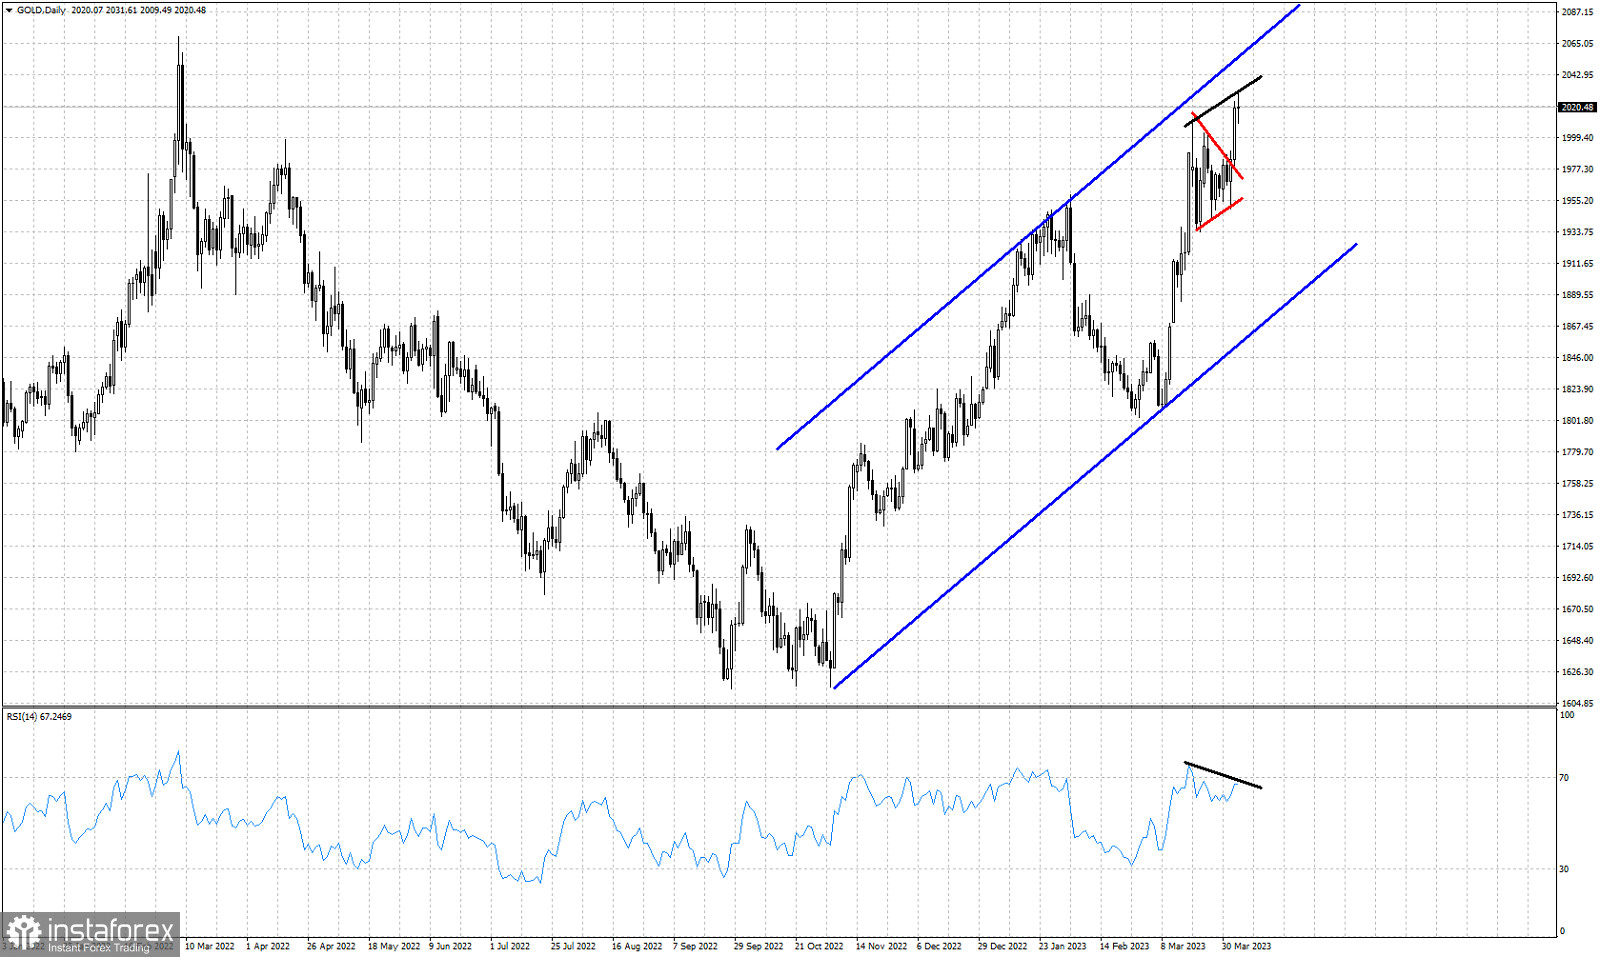
Blue lines- bullish channel
Red lines- triangle pattern (broken upwards)
Black lines- bearish RSI divergence
Gold price is trading around $2,020. Short-term trend is bullish as price continues trading inside the upward sloping blue channel since October of 2022. Price has broken out of the triangle pattern providing a new bullish signal. Our target as we mentioned in previous posts was around $2,050-60. So far price has bounced as high as $2,031.Despite the new higher high in price, the RSI did not follow. The RSI has provided a bearish divergence. This is only a warning and not a reversal signal. Support is found at the base of the triangle pattern around $1,981. Holding above this level is key for the short-term trend. I believe we are at the final stages of the upward move that started back in October 2022. Upside potential is towards $2,050-60. Downside potential of a pull back is towards $1.880.
*La presente analisi del mercato ha un carattere esclusivamente informativo e non rappresenta una guida per l`effettuazione di una transazione.
Le recensioni analitiche di InstaSpot ti renderanno pienamente consapevole delle tendenze del mercato! Essendo un cliente InstaSpot, ti viene fornito un gran numero di servizi gratuiti per il trading efficiente.


