


Tim kami memiliki lebih dari 7.000.000 trader!
Setiap harinya kami bekerja sama untuk meningkatkan trading. Kami memperoleh hasil tinggi dan terus bergerak maju.
Pengakuan dari jutaan trader diseluruh dunia merupakan apresiasi terbaik dari kerja kami! Anda membuat pilihan anda dan kami akan melakukan semua yang dibutuhkan untuk memenuhi ekspektasi anda!
We are a great team together!
InstaSpot. Bangga bekerja bersama anda!


Seorang Aktor, juara 6 turnamen UFC dan pahlawan sesungguhnya!
Pria yang berhasil. Pria yang berusaha keras.
Rahasia dibalik kesuksesan Taktarov adalah pergerakan konstan menuju target.
Tunjukkan seluruh sisi dari bakat anda!
Temukan, coba, gagal - namun jangan pernah berhenti!
InstaSpot. Cerita sukses anda dimulai disini!

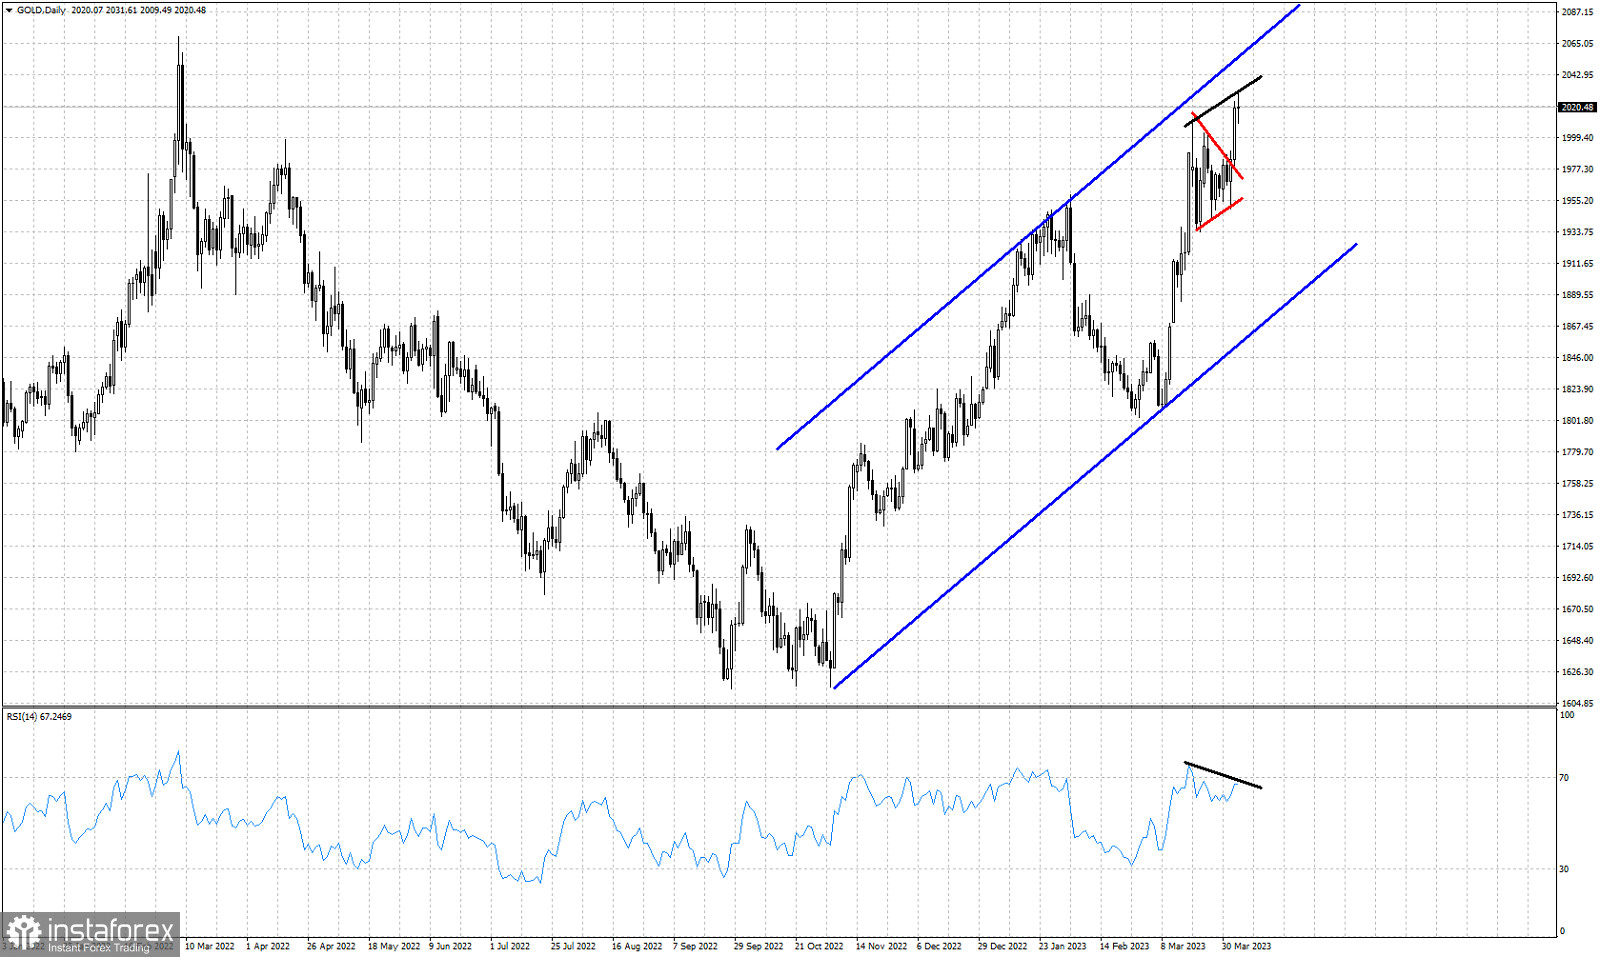
Blue lines- bullish channel
Red lines- triangle pattern (broken upwards)
Black lines- bearish RSI divergence
Gold price is trading around $2,020. Short-term trend is bullish as price continues trading inside the upward sloping blue channel since October of 2022. Price has broken out of the triangle pattern providing a new bullish signal. Our target as we mentioned in previous posts was around $2,050-60. So far price has bounced as high as $2,031.Despite the new higher high in price, the RSI did not follow. The RSI has provided a bearish divergence. This is only a warning and not a reversal signal. Support is found at the base of the triangle pattern around $1,981. Holding above this level is key for the short-term trend. I believe we are at the final stages of the upward move that started back in October 2022. Upside potential is towards $2,050-60. Downside potential of a pull back is towards $1.880.
*Analisis pasar yang diposting disini dimaksudkan untuk meningkatkan pengetahuan Anda namun tidak untuk memberi instruksi trading.
Tinjauan analitis InstaSpot akan membuat Anda menyadari sepenuhnya tren pasar! Sebagai klien InstaSpot, Anda dilengkapi dengan sejumlah besar layanan gratis untuk trading yang efisien.


