


Our team has over 7,000,000 traders!
Every day we work together to improve trading. We get high results and move forward.
Recognition by millions of traders all over the world is the best appreciation of our work! You made your choice and we will do everything it takes to meet your expectations!
We are a great team together!
InstaSpot. Proud to work for you!


Actor, UFC 6 tournament champion and a true hero!
The man who made himself. The man that goes our way.
The secret behind Taktarov's success is constant movement towards the goal.
Reveal all the sides of your talent!
Discover, try, fail - but never stop!
InstaSpot. Your success story starts here!

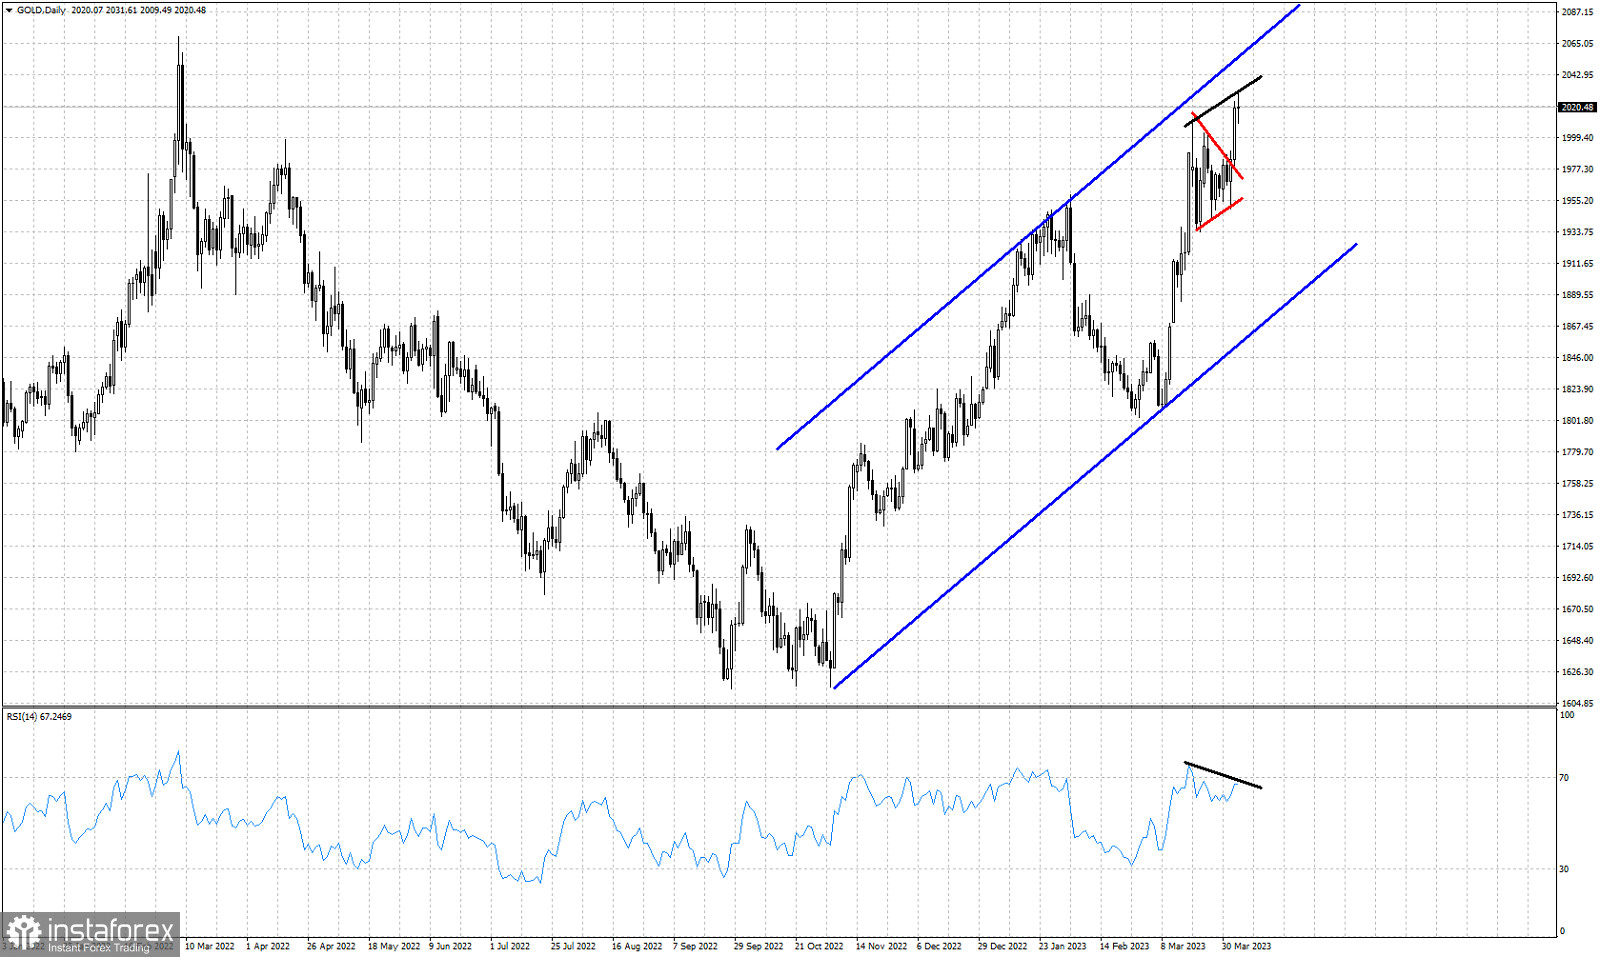
Blue lines- bullish channel
Red lines- triangle pattern (broken upwards)
Black lines- bearish RSI divergence
Gold price is trading around $2,020. Short-term trend is bullish as price continues trading inside the upward sloping blue channel since October of 2022. Price has broken out of the triangle pattern providing a new bullish signal. Our target as we mentioned in previous posts was around $2,050-60. So far price has bounced as high as $2,031.Despite the new higher high in price, the RSI did not follow. The RSI has provided a bearish divergence. This is only a warning and not a reversal signal. Support is found at the base of the triangle pattern around $1,981. Holding above this level is key for the short-term trend. I believe we are at the final stages of the upward move that started back in October 2022. Upside potential is towards $2,050-60. Downside potential of a pull back is towards $1.880.
*এখানে পোস্ট করা মার্কেট বিশ্লেষণ আপনার সচেতনতা বৃদ্ধির জন্য প্রদান করা হয়, ট্রেড করার নির্দেশনা প্রদানের জন্য প্রদান করা হয় না।
ইন্সটাফরেক্স বিশ্লেষণমূলক পর্যালোচনাগুলো আপনাকে মার্কেট প্রবণতা সম্পর্কে পুরোপুরি সচেতন করবে! ইন্সটাফরেক্সের একজন গ্রাহক হওয়ায়, দক্ষ ট্রেডিং এর জন্য আপনাকে অনেক সেবা বিনামূল্যে প্রদান করা হয়।


