


¡Nuestro equipo cuenta con más de 7,000,000 operadores!
Cada día, trabajamos juntos para mejorar las operaciones. Obtenemos grandes resultados y seguimos adelante.
El reconocimiento de millones de operadores en todo el mundo es el mejor agradecimiento a nuestro trabajo! ¡Usted hizo su elección y haremos todo lo que esté a nuestro alcance para satisfacer sus expectativas!
¡Juntos somos un gran equipo!
InstaSpot. ¡Orgulloso de trabajar para usted!


¡Actor, 6 veces ganador del torneo UFC y un verdadero héroe!
El hombre que se hizo a sí mismo. El hombre que sigue nuestro camino.
El secreto detrás del éxito de Taktarov es el constante movimiento hacia el objetivo.
¡Revele todo los lados de su talento!
Descubra, intente, fracase, ¡pero nunca se rinda!
InstaSpot. ¡Su historia de éxito comienza aquí!
Overview :
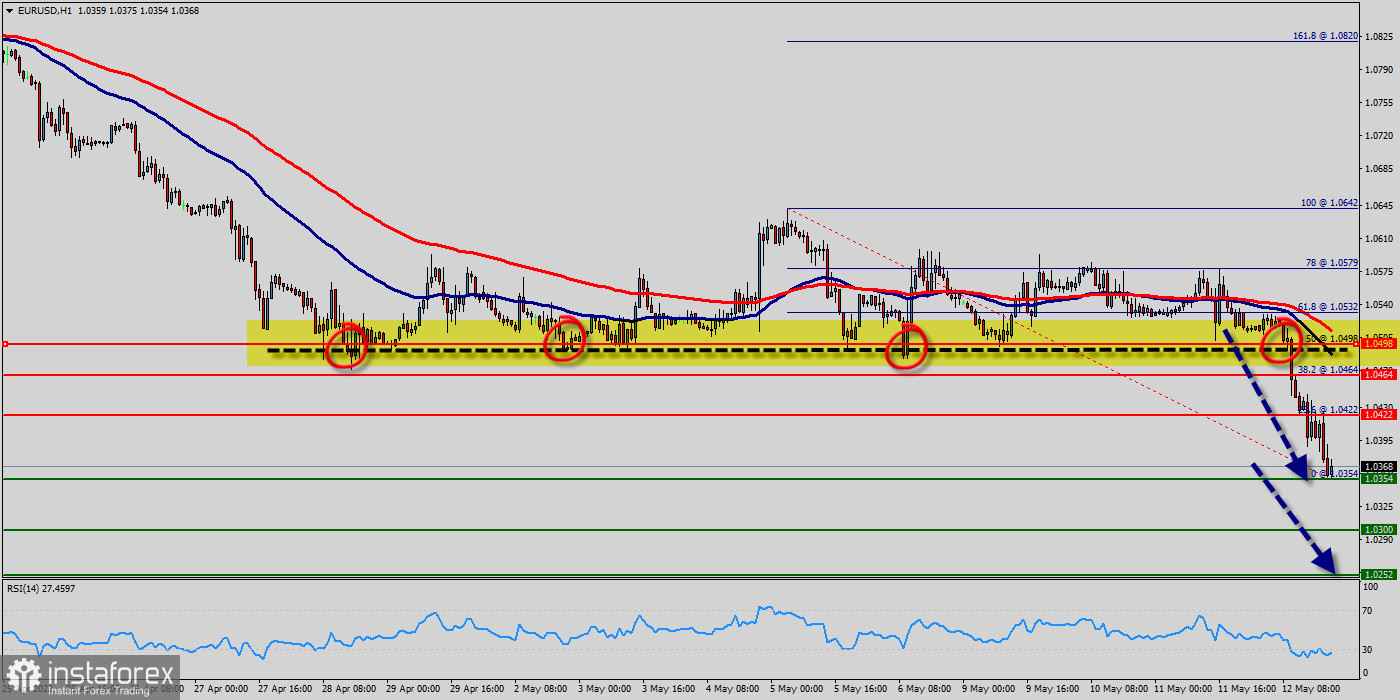
As expected the EUR/USD pair continues to move downwards from the areas of 1.0422 and 1.0464 which coincides with a ratio of 38.2% Fibonacci on the H1 chart.
Yesterday, the pair dropped from the level of 1.0464 to 1.0354, . Today, resistance is seen at the levels of 1.0422 and 1.0464. So, we expect the price to set below the strong resistance at the levels of 1.0464 and 1.0422; because the price is in a bearish channel now.
Amid the previous events, the price is still moving between the levels of 1.0422 and 1.0354. In overall, we still prefer the bearish scenario as long as the price is below the level of 1.0422.
Today, the first support level is seen at 1.0354, the price is moving in a bearish channel now. Furthermore, the price has been set below the strong resistance at the level of 1.0422, which coincides with the 23.6% Fibonacci retracement level.
This resistance has been rejected several times confirming the veracity of a downtrend. Additionally, the RSI starts signaling a downward trend.
This is confirmed by the RSI indicator signaling that we are still in a bearish trending market. The price is still below the moving average (100) and (50).
Furthermore, if the EUR/USD pair is able to break out the bottom at 1.0354, the market will decline further to 1.0300 (daily support 2).
The price will fall into a bearish trend in order to go further towards the strong support at 1.0252 to test it again. The level of 1.0252 will form a new double bottom.
On the other hand, if the price closes above the strong resistance of 1.0498, the best location for a stop loss order is seen above 1.05025.
*El análisis de mercado publicado aquí tiene la finalidad de incrementar su conocimiento, más no darle instrucciones para realizar una operación.
¡Los informes analíticos de InstaSpot lo mantendrá bien informado de las tendencias del mercado! Al ser un cliente de InstaSpot, se le proporciona una gran cantidad de servicios gratuitos para una operación eficiente.


