


ทีมงานของพวกเรา พร้อมกับเทรดเดอร์มากกว่า 7,000,000 คน!
ในทุกวัน พวกเราได้รวมงานร่วมกันเพื่อพัฒนาการเทรด พวกเรามีผลตอบรับที่ดี และยังเดินหน้าต่อไป
การยอมรับจากเทรดเดอร์นับล้านจากทั่วทุกมุมโลกนั้นเป็น ผลงา่นอันน่าประทับใจมากที่สุดของพวกเรา! คุณเลือกตัวเลือก และพวกเราจะจัดการทุกอย่างให้ตรงกับการคาดหวังของคุณ !
พวกเราเป็นทีมงานที่ดีที่สุด!
InstaSpot รู้สึกเป็นเกียรติที่ได้ร่วมงานกับคุณ !


นักแสดง, แชมป์เปี้ยนทัวร์นาเม้น UFC 6 และฮิโรที่แท้จริง !
ชายผู้สามารถก่อร่างสร้างตัวขึ้นมาได้ด้วยตัวเขาเอง ชายผู้ที่นำพาเส้นทางให้พวกเรา
ความลับที่อยู่เบื้องหลังความสำเร็จของ Taktarov ก็คือการมุ่งหน้าไปสู่เป้าหมายแบบทันที
เปิดเผยทุกด้านของความสำเร็จคุณ !
ค้นพบ, พยายาม, ผิดพลาดได้ แต่อย่าพึ่งหยุดยั่ง !
InstaSpot ที่พร้อมจะเป็นจุดเริ่มต้น เรื่องราวความสำเร็จของคุณ !

Overview :
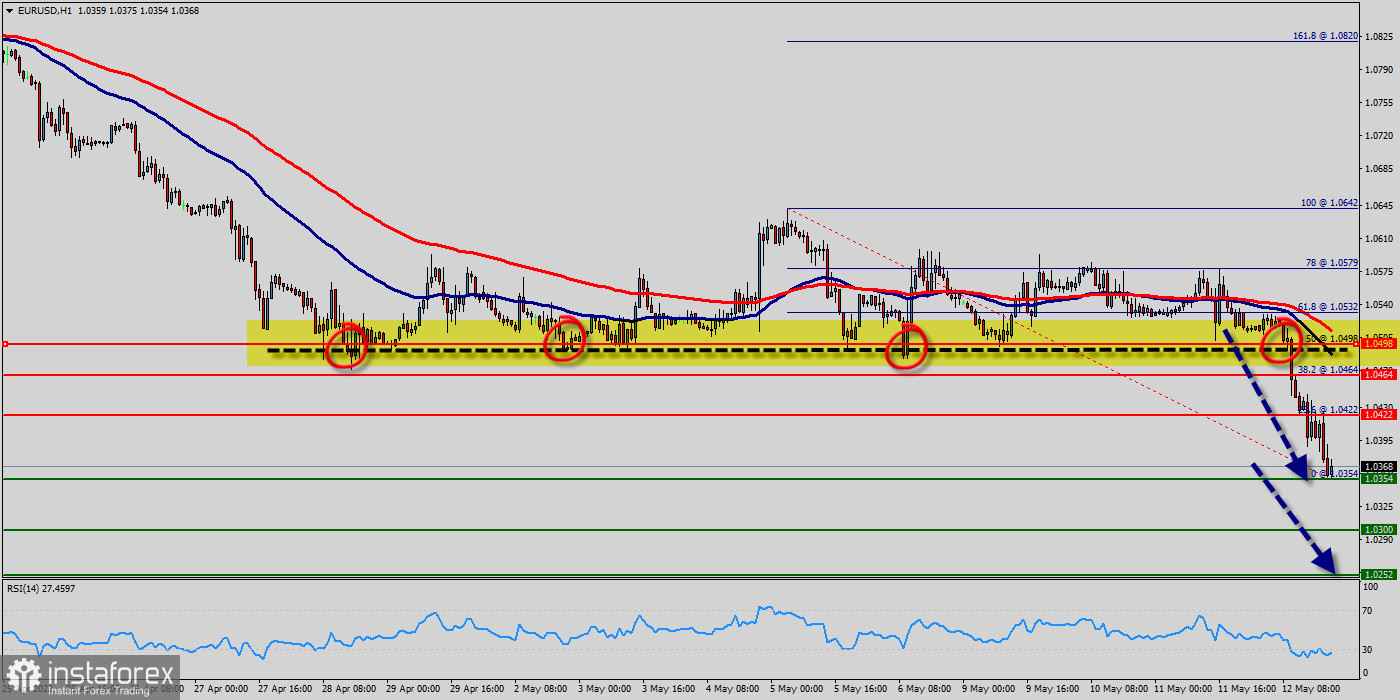
As expected the EUR/USD pair continues to move downwards from the areas of 1.0422 and 1.0464 which coincides with a ratio of 38.2% Fibonacci on the H1 chart.
Yesterday, the pair dropped from the level of 1.0464 to 1.0354, . Today, resistance is seen at the levels of 1.0422 and 1.0464. So, we expect the price to set below the strong resistance at the levels of 1.0464 and 1.0422; because the price is in a bearish channel now.
Amid the previous events, the price is still moving between the levels of 1.0422 and 1.0354. In overall, we still prefer the bearish scenario as long as the price is below the level of 1.0422.
Today, the first support level is seen at 1.0354, the price is moving in a bearish channel now. Furthermore, the price has been set below the strong resistance at the level of 1.0422, which coincides with the 23.6% Fibonacci retracement level.
This resistance has been rejected several times confirming the veracity of a downtrend. Additionally, the RSI starts signaling a downward trend.
This is confirmed by the RSI indicator signaling that we are still in a bearish trending market. The price is still below the moving average (100) and (50).
Furthermore, if the EUR/USD pair is able to break out the bottom at 1.0354, the market will decline further to 1.0300 (daily support 2).
The price will fall into a bearish trend in order to go further towards the strong support at 1.0252 to test it again. The level of 1.0252 will form a new double bottom.
On the other hand, if the price closes above the strong resistance of 1.0498, the best location for a stop loss order is seen above 1.05025.
*บทวิเคราะห์ในตลาดที่มีการโพสต์ตรงนี้ เพียงเพื่อทำให้คุณทราบถึงข้อมูล ไม่ได้เป็นการเจาะจงถึงขั้นตอนให้คุณทำการซื้อขายตาม
บทวิเคราะห์ของทาง InstaSpot จะทำให้คุณทราบถึงแนวโน้มของตลาด! ในการที่เป็นลูกค้าของทาง InstaSpot นั้นคุณจะได้รับการบริการเพื่อการซื้อขายอย่างเต็มประสิทธิภาพอย่างมากมาย


