


Tim kami memiliki lebih dari 7.000.000 trader!
Setiap harinya kami bekerja sama untuk meningkatkan trading. Kami memperoleh hasil tinggi dan terus bergerak maju.
Pengakuan dari jutaan trader diseluruh dunia merupakan apresiasi terbaik dari kerja kami! Anda membuat pilihan anda dan kami akan melakukan semua yang dibutuhkan untuk memenuhi ekspektasi anda!
We are a great team together!
InstaSpot. Bangga bekerja bersama anda!


Seorang Aktor, juara 6 turnamen UFC dan pahlawan sesungguhnya!
Pria yang berhasil. Pria yang berusaha keras.
Rahasia dibalik kesuksesan Taktarov adalah pergerakan konstan menuju target.
Tunjukkan seluruh sisi dari bakat anda!
Temukan, coba, gagal - namun jangan pernah berhenti!
InstaSpot. Cerita sukses anda dimulai disini!

Overview :
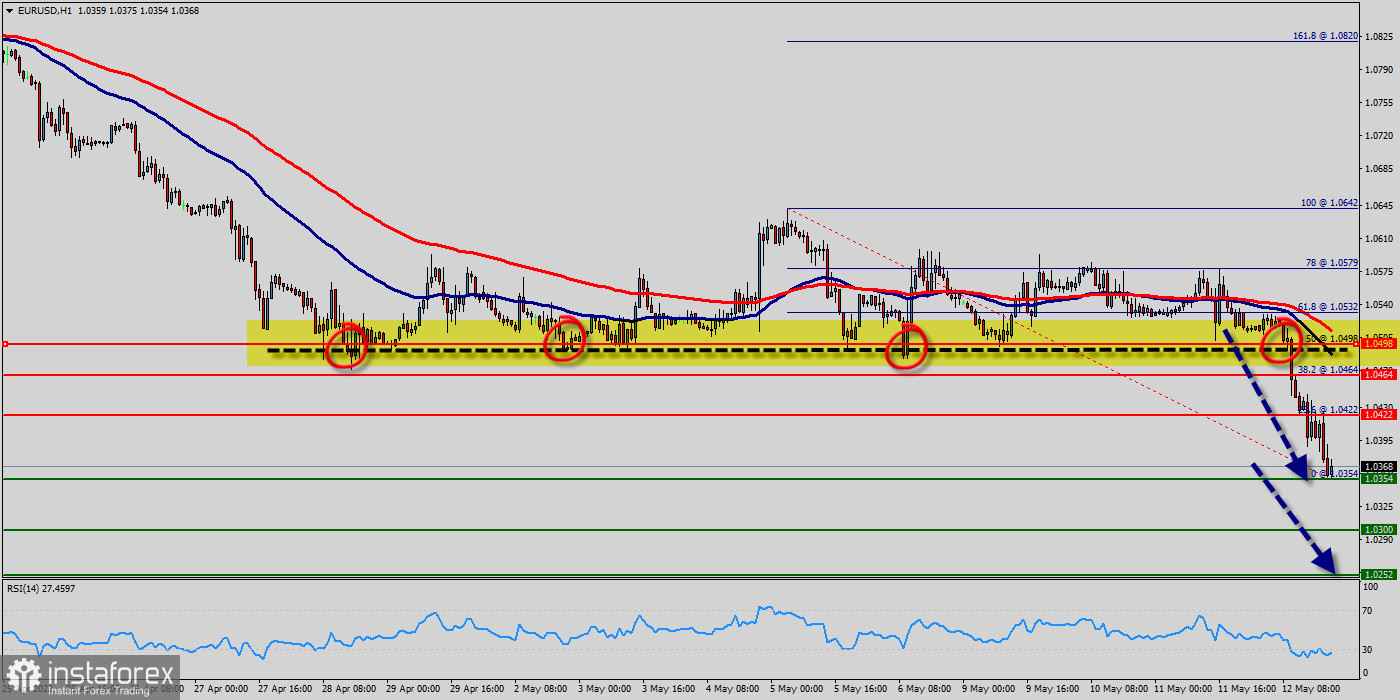
As expected the EUR/USD pair continues to move downwards from the areas of 1.0422 and 1.0464 which coincides with a ratio of 38.2% Fibonacci on the H1 chart.
Yesterday, the pair dropped from the level of 1.0464 to 1.0354, . Today, resistance is seen at the levels of 1.0422 and 1.0464. So, we expect the price to set below the strong resistance at the levels of 1.0464 and 1.0422; because the price is in a bearish channel now.
Amid the previous events, the price is still moving between the levels of 1.0422 and 1.0354. In overall, we still prefer the bearish scenario as long as the price is below the level of 1.0422.
Today, the first support level is seen at 1.0354, the price is moving in a bearish channel now. Furthermore, the price has been set below the strong resistance at the level of 1.0422, which coincides with the 23.6% Fibonacci retracement level.
This resistance has been rejected several times confirming the veracity of a downtrend. Additionally, the RSI starts signaling a downward trend.
This is confirmed by the RSI indicator signaling that we are still in a bearish trending market. The price is still below the moving average (100) and (50).
Furthermore, if the EUR/USD pair is able to break out the bottom at 1.0354, the market will decline further to 1.0300 (daily support 2).
The price will fall into a bearish trend in order to go further towards the strong support at 1.0252 to test it again. The level of 1.0252 will form a new double bottom.
On the other hand, if the price closes above the strong resistance of 1.0498, the best location for a stop loss order is seen above 1.05025.
*Analisis pasar yang diposting disini dimaksudkan untuk meningkatkan pengetahuan Anda namun tidak untuk memberi instruksi trading.
Tinjauan analitis InstaSpot akan membuat Anda menyadari sepenuhnya tren pasar! Sebagai klien InstaSpot, Anda dilengkapi dengan sejumlah besar layanan gratis untuk trading yang efisien.


