


انسٹا فاریکس ٹیم میں لیجنڈ!
لیجنڈ!آپ کو لگتا ہے کہ یہ حیرت انگیز بیانات ہے؟ لیکن ہمیں ایسے شخص کو کیا کہنا چاہئے ، جو 18 سال میں جونیئر ورلڈ شطرنج چیمپئن شپ جیتنے والا پہلا ایشین بن گیا تھا اور 19 میں پہلا ہندوستانی گرینڈ ماسٹر بنا؟ ورلڈ چیمپیئن ٹائٹل کے لئے یہ مشکل آغاز تھا جو وشونااتھ آنند کے لئے تھا ، وہ شخص جو ہمیشہ کے لئے شطرنج کی تاریخ کا حصہ بن گیا تھا۔ انسٹا فاریکس ٹیم میں اب ایک اور لیجنڈ!


Borussia is one of the most titled football clubs in Germany, which has repeatedly proved to fans: the spirit of competition and leadership will certainly lead to success. Trade in the same way that sports professionals play the game: confidently and actively. Keep a "pass" from Borussia FC and be in the lead with InstaSpot!

Overview :
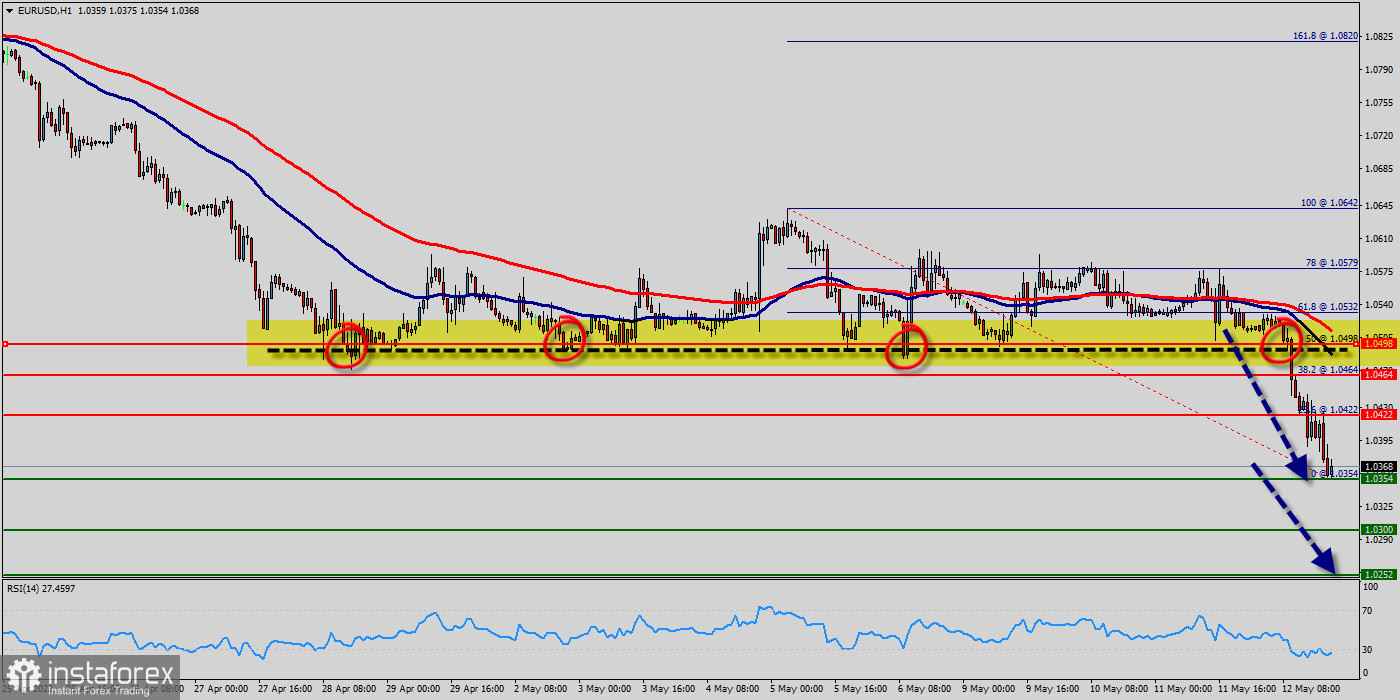
As expected the EUR/USD pair continues to move downwards from the areas of 1.0422 and 1.0464 which coincides with a ratio of 38.2% Fibonacci on the H1 chart.
Yesterday, the pair dropped from the level of 1.0464 to 1.0354, . Today, resistance is seen at the levels of 1.0422 and 1.0464. So, we expect the price to set below the strong resistance at the levels of 1.0464 and 1.0422; because the price is in a bearish channel now.
Amid the previous events, the price is still moving between the levels of 1.0422 and 1.0354. In overall, we still prefer the bearish scenario as long as the price is below the level of 1.0422.
Today, the first support level is seen at 1.0354, the price is moving in a bearish channel now. Furthermore, the price has been set below the strong resistance at the level of 1.0422, which coincides with the 23.6% Fibonacci retracement level.
This resistance has been rejected several times confirming the veracity of a downtrend. Additionally, the RSI starts signaling a downward trend.
This is confirmed by the RSI indicator signaling that we are still in a bearish trending market. The price is still below the moving average (100) and (50).
Furthermore, if the EUR/USD pair is able to break out the bottom at 1.0354, the market will decline further to 1.0300 (daily support 2).
The price will fall into a bearish trend in order to go further towards the strong support at 1.0252 to test it again. The level of 1.0252 will form a new double bottom.
On the other hand, if the price closes above the strong resistance of 1.0498, the best location for a stop loss order is seen above 1.05025.
*تعینات کیا مراد ہے مارکیٹ کے تجزیات یہاں ارسال کیے جاتے ہیں جس کا مقصد آپ کی بیداری بڑھانا ہے، لیکن تجارت کرنے کے لئے ہدایات دینا نہیں.
InstaSpot analytical reviews will make you fully aware of market trends! Being an InstaSpot client, you are provided with a large number of free services for efficient trading.


