


¡La leyenda en el equipo de InstaSpot!
¡Leyenda! ¿Cree que es una retórica grandilocuente? Pero, ¿cómo deberíamos llamar a un hombre, que se convirtió en el primer asiático en ganar el campeonato mundial de ajedrez júnior a los 18 años y en el primer Gran Maestro indio a los 19 años? Ese fue el comienzo de un camino difícil hacia el título de Campeón del Mundo para Viswanathan Anand, el hombre que se convirtió en parte de la historia del ajedrez para siempre. ¡Ahora una leyenda más en el equipo de InstaSpot!


Borussia es uno de los clubes de fútbol con más títulos en Alemania, que ha demostrado repetidamente a los fanáticos: el espíritu de competencia y liderazgo que ciertamente conducirán al éxito. Opere de la misma manera que los profesionales del deporte: con confianza y de forma activa. ¡Mantenga un "pase" del Borussia FC y lidere con InstaSpot!
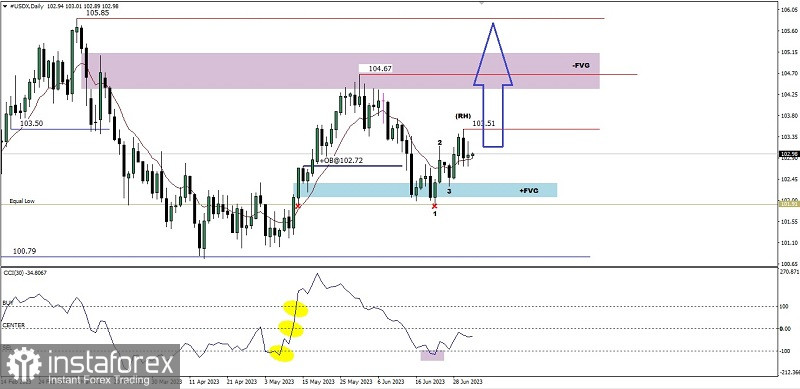
If we look at the daily chart #USDX you can see the CCI indicator after successfully breaking above these three levels then it went down again but was stuck at the -100 level which means that there is a significant support holding back the downward correction rate where if we pay attention to price movements there appears an Equal Low area and a level the Bullish Fair value Gap area so that a Bullish 123 pattern is formed which is followed by the appearance of a Ross Hook (RH) so based on the above it is predicted that in the next few days #USDX has the potential to break above the Ross Hook level of 103.51 and if this level is successfully broken then #USDX will have the potential to continue strengthening up to the level of 104.67 as the main target and 105.85 will be the second target. However, please pay attention to the potential to test the Equal Low area level where there is a lot of liquidity which is often targeted by Big Players so that if the 101.91 area is successfully breaks below, the strengthening scenario that has been previously described has the potential to become invalid and automatically cancels itself.
(Disclaimer)
*El análisis de mercado publicado aquí tiene la finalidad de incrementar su conocimiento, más no darle instrucciones para realizar una operación.
¡Los informes analíticos de InstaSpot lo mantendrá bien informado de las tendencias del mercado! Al ser un cliente de InstaSpot, se le proporciona una gran cantidad de servicios gratuitos para una operación eficiente.


