


The legend in the InstaSpot team!
Legend! You think that's bombastic rhetoric? But how should we call a man, who became the first Asian to win the junior world chess championship at 18 and who became the first Indian Grandmaster at 19? That was the start of a hard path to the World Champion title for Viswanathan Anand, the man who became a part of history of chess forever. Now one more legend in the InstaSpot team!


Borussia is one of the most titled football clubs in Germany, which has repeatedly proved to fans: the spirit of competition and leadership will certainly lead to success. Trade in the same way that sports professionals play the game: confidently and actively. Keep a "pass" from Borussia FC and be in the lead with InstaSpot!
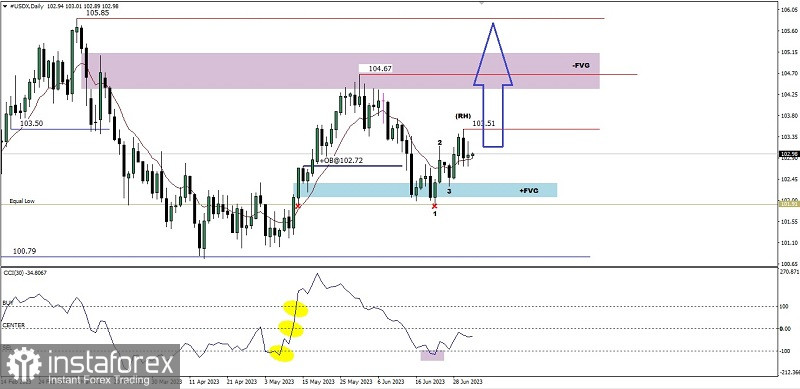
If we look at the daily chart #USDX you can see the CCI indicator after successfully breaking above these three levels then it went down again but was stuck at the -100 level which means that there is a significant support holding back the downward correction rate where if we pay attention to price movements there appears an Equal Low area and a level the Bullish Fair value Gap area so that a Bullish 123 pattern is formed which is followed by the appearance of a Ross Hook (RH) so based on the above it is predicted that in the next few days #USDX has the potential to break above the Ross Hook level of 103.51 and if this level is successfully broken then #USDX will have the potential to continue strengthening up to the level of 104.67 as the main target and 105.85 will be the second target. However, please pay attention to the potential to test the Equal Low area level where there is a lot of liquidity which is often targeted by Big Players so that if the 101.91 area is successfully breaks below, the strengthening scenario that has been previously described has the potential to become invalid and automatically cancels itself.
(Disclaimer)
*这里的市场分析是为了增加您对市场的了解,而不是给出交易的指示。
InstaSpot分析评论将让您充分了解市场趋势! 作为InstaSpot的客户,您将获得大量的免费服务以实现有效的交易。


