


فريقنا لديه أكثر من 7,000,000 من التجار!
كل يوم نعمل معا لتحسين التداول. نحصل على نتائج عالية ونمضي قدما.
الاعتراف من قبل الملايين من التجار في جميع أنحاء العالم هو أفضل تقدير لعملنا! لقد قمت باختيارك وسنفعل كل ما يلزم لتلبية توقعاتك!
نحن فريق رائع معا!
إنستافوركس تعتز بالعمل بالنسبة لك!


الممثل وبطل مسابقة يو إف سي 6 وبطل حقيقي!
الرجل الذي حقق النجاح بعمله الدؤوب. الرجل الذي يذهب كما نريد.
سر نجاح تاكتاروف هو حركة مستمرة نحو الهدف.
اكشف عن جميع جوانب موهبتك!
اكتشف، وحاول، وافشل - ولكن لا تتوقف أبدا!
إنستافوركس. تبدأ قصة نجاحك من هنا!
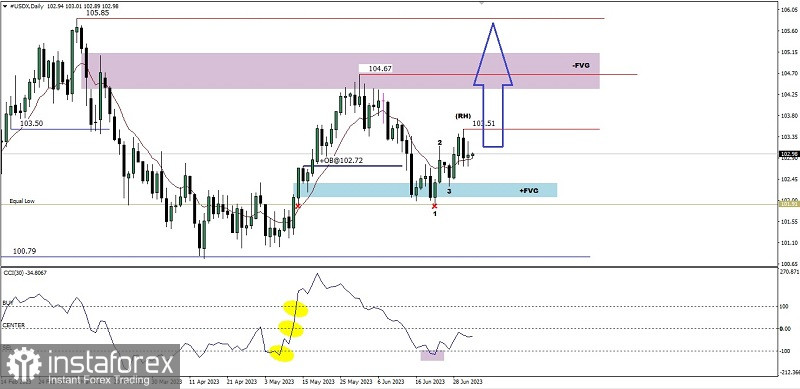
If we look at the daily chart #USDX you can see the CCI indicator after successfully breaking above these three levels then it went down again but was stuck at the -100 level which means that there is a significant support holding back the downward correction rate where if we pay attention to price movements there appears an Equal Low area and a level the Bullish Fair value Gap area so that a Bullish 123 pattern is formed which is followed by the appearance of a Ross Hook (RH) so based on the above it is predicted that in the next few days #USDX has the potential to break above the Ross Hook level of 103.51 and if this level is successfully broken then #USDX will have the potential to continue strengthening up to the level of 104.67 as the main target and 105.85 will be the second target. However, please pay attention to the potential to test the Equal Low area level where there is a lot of liquidity which is often targeted by Big Players so that if the 101.91 area is successfully breaks below, the strengthening scenario that has been previously described has the potential to become invalid and automatically cancels itself.
(Disclaimer)
*The market analysis posted here is meant to increase your awareness, but not to give instructions to make a trade.
InstaSpot analytical reviews will make you fully aware of market trends! Being an InstaSpot client, you are provided with a large number of free services for efficient trading.


