


Легендата в екипа на ИнстаФорекс!
Легенда! Мислите ли, че това е бомбастична реторика? Но как да наречем човек, който на 18 години стана първият азиатец спечелил световния шампионат по шах за юноши и на 19 години стана първият гросмайстор на Индия? Това беше началото на труден път към титлата на световен шампион за Вишванатан Ананд, човекът, който стана част от историята на шаха завинаги. Сега още една легенда в екипа на ИнстаФорекс!


Борусия е един от най-титулуваните футболни клубове в Германия, който многократно се е доказал пред феновете: духът на конкуренция и лидерство със сигурност ще доведе до успех. Търгувайте по същия начин, по който спортните професионалисти играят играта: уверено и активно. Запазете „пас" от ФК „Борусия" и бъдете начело с ИнстаФорекс!

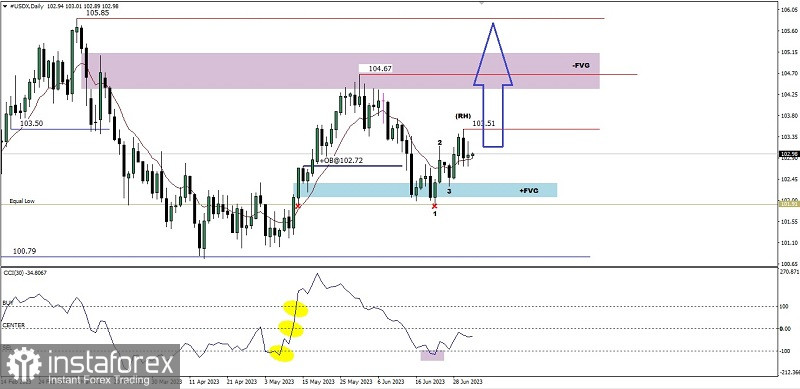
If we look at the daily chart #USDX you can see the CCI indicator after successfully breaking above these three levels then it went down again but was stuck at the -100 level which means that there is a significant support holding back the downward correction rate where if we pay attention to price movements there appears an Equal Low area and a level the Bullish Fair value Gap area so that a Bullish 123 pattern is formed which is followed by the appearance of a Ross Hook (RH) so based on the above it is predicted that in the next few days #USDX has the potential to break above the Ross Hook level of 103.51 and if this level is successfully broken then #USDX will have the potential to continue strengthening up to the level of 104.67 as the main target and 105.85 will be the second target. However, please pay attention to the potential to test the Equal Low area level where there is a lot of liquidity which is often targeted by Big Players so that if the 101.91 area is successfully breaks below, the strengthening scenario that has been previously described has the potential to become invalid and automatically cancels itself.
(Disclaimer)
*Анализът на пазара публикуван тук има за цел да повиши информираността Ви, но не и да дава указания за търговия.
Аналитичните прегледи на ИнстаФорекс ще ви запознаят изцяло с пазарните тенденции! Като клиент на ИнстаФорекс, на вас се предоставят голям брой безплатни услуги за ефикасна търговия.


