


ہمارے ٹیم میں 7000000 سے ذائد تاجران شامل ہیں
ہم تجارت کی بہتری کے لئے ہر روز اکھٹے کام کرتے ہیں اور بہترین نتائج حاصل کرتے ہوئے آگے کی جانب بڑھتے ہیں
دُنیا بھر سے سے لاکھوں ہمارے بہترین کام کو سند عطاء کرتے ہیں آپ اپنا انتحاب کریں باقی ہم آپ کی توقعات پر پورا اترنے کے لئے اپنی بہترین کوشش کریں گے
ہم مل کر ایک بہترین ٹیم بناتے ہیں
انسٹا فاریکس آپ سے کام کرتے ہوئے فخر محسوس کرتا ہے


ایکٹر - یو سی ایف 6 ٹورنامنٹ چیمپین اور واقعی ہیرو
ایک فرد کے جس نے اپنا آپ منوایا ہے وہ فرد کہ جو ہماری راہ پر چلا ہے.
ٹکٹا روو کی کامیابی کا راز یہ ہے کہ وہ اپنے اہداف کی جانب مسلسل بڑھتا رہتا ہے
اپنے ہنر یا ٹیلنٹ کے تمام پہلو آشکار کررہے ہیں
پہچانیں ، کوشش کریں ، ناکام ہوں لیکن کبھی نہ رُکیں
انسٹا فاریکس آپ کی کامیابی کی کہاں یہاں سے شروع ہوتی ہے

Monday, as usual, was accompanied by an empty macroeconomic calendar. Important statistical data was not published in the European Union, the United Kingdom, and the United States.
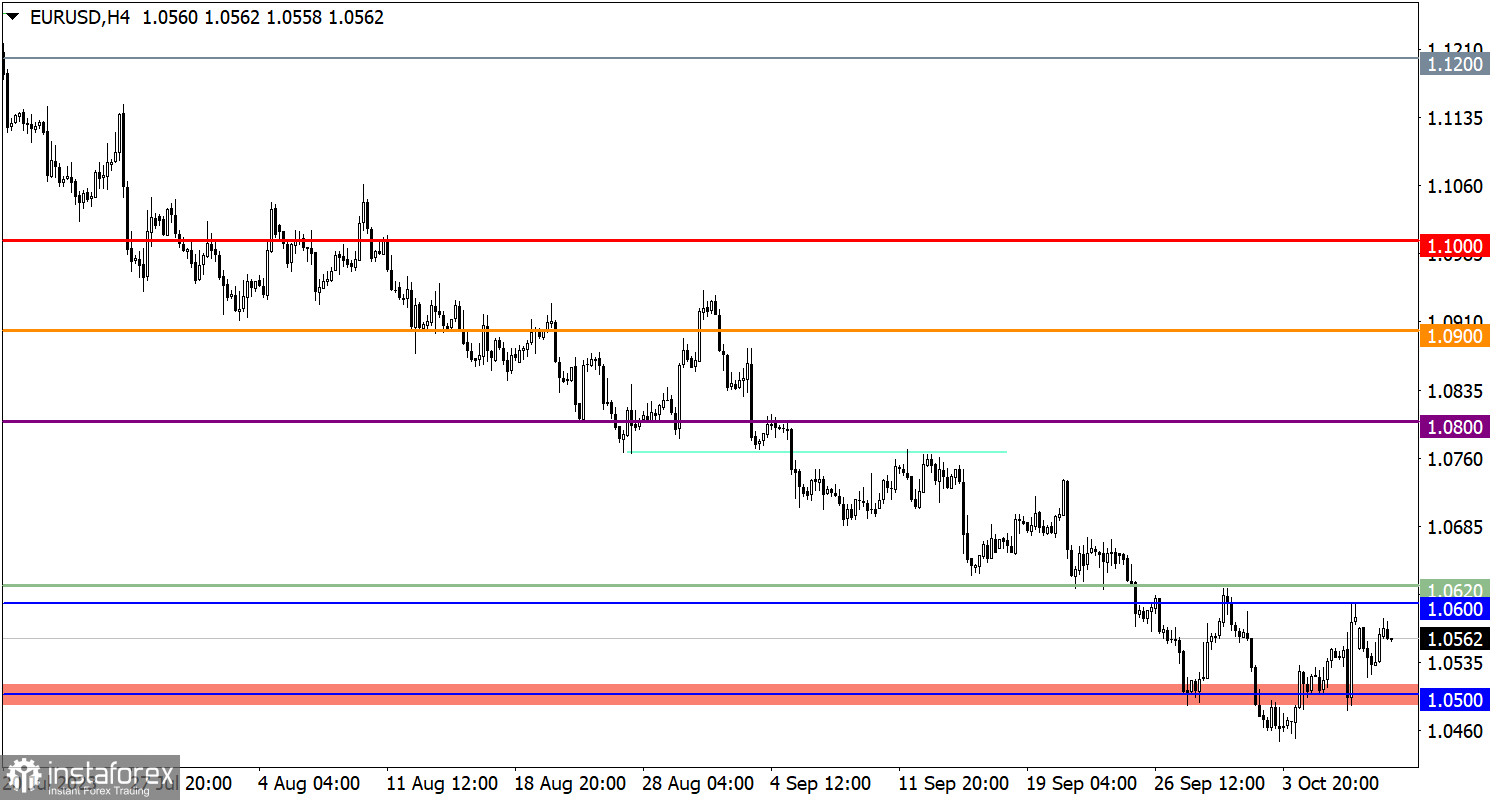
The EUR/USD currency pair continues to be in a correction phase despite a noticeable reduction in long positions' volume. Resistance in this pair is forming in the range of 1.0600–1.0620.
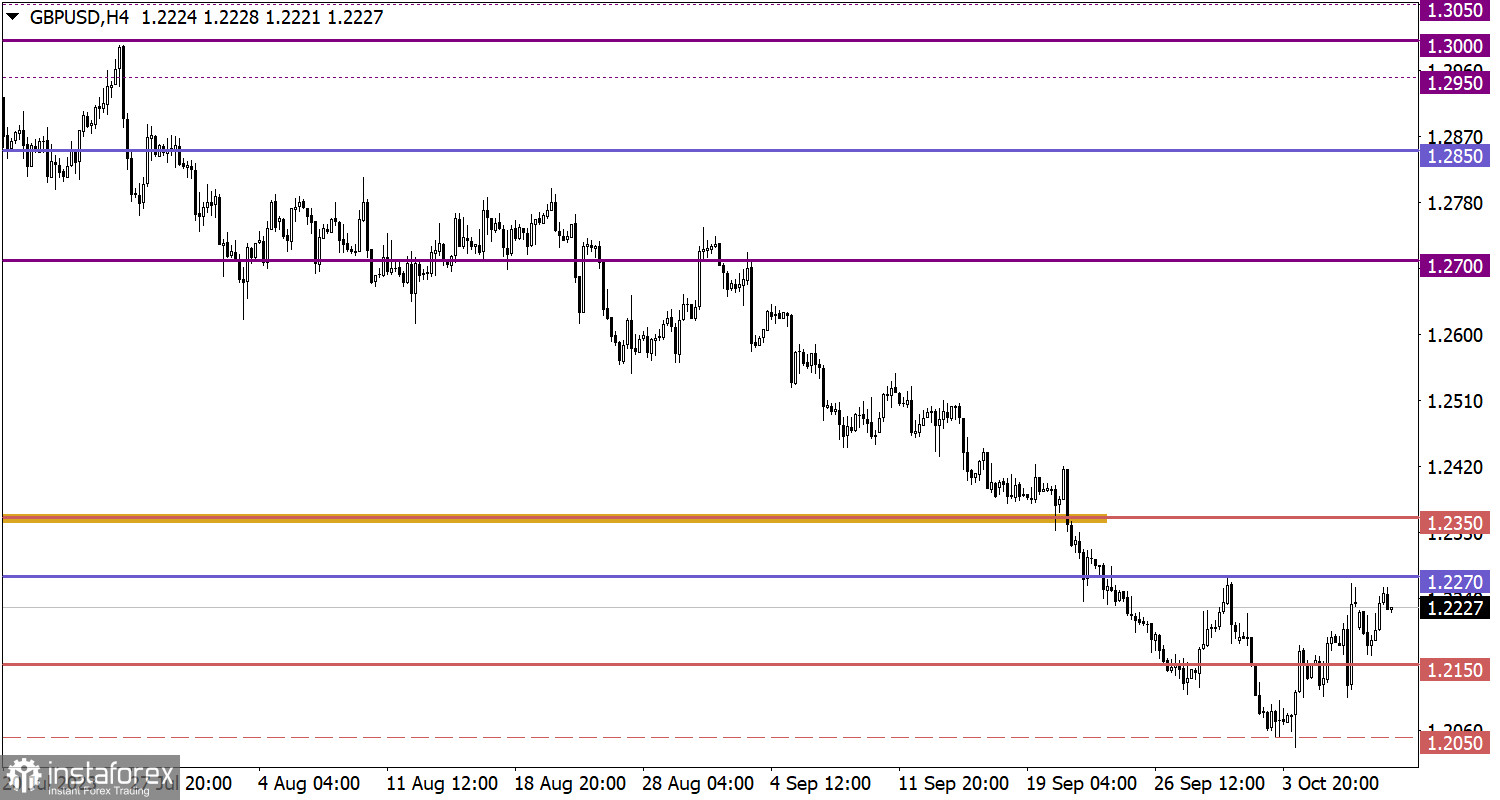
The GBP/USD pair, despite high volatility, remains at levels close to those of Friday. Currently, the corridor for this pair is forming between the levels of 1.2150 and 1.2270.
Tuesday looks similar to Monday in the sense that the macroeconomic calendar remains practically empty. The only event worth noting is the publication of the minutes of the Bank of England's Financial Policy Committee meeting. However, one should not expect anything new from this event; it is more likely to be a clarification of details.
To continue the upward movement, the price needs to stay above the resistance level area. In this case, one can expect growth towards the level of 1.0680. Otherwise, the price may fluctuate in the range between 1.0500 and 1.0600.
For further upward correction, it is necessary for the price to establish itself above the level of 1.2270. In this case, a gradual increase in the exchange rate towards the level of 1.2350 can be expected.
As for the downward scenario, an increase in short positions is expected if the price falls below the level of 1.2100. In this case, a local low may be updated, with support at the lower zone of the psychological level of 1.1950/1.2000.
The candlestick chart type is white and black graphic rectangles with lines above and below. With a detailed analysis of each individual candle, you can see its characteristics relative to a particular time frame: opening price, closing price, intraday high and low.
Horizontal levels are price coordinates, relative to which a price may stop or reverse its trajectory. In the market, these levels are called support and resistance.
Circles and rectangles are highlighted examples where the price reversed in history. This color highlighting indicates horizontal lines that may put pressure on the asset's price in the future.
The up/down arrows are landmarks of the possible price direction in the future.
*تعینات کیا مراد ہے مارکیٹ کے تجزیات یہاں ارسال کیے جاتے ہیں جس کا مقصد آپ کی بیداری بڑھانا ہے، لیکن تجارت کرنے کے لئے ہدایات دینا نہیں.
InstaSpot analytical reviews will make you fully aware of market trends! Being an InstaSpot client, you are provided with a large number of free services for efficient trading.


