


ตำนานแห่งทีม InstaSpot!
ที่สุด! คุณคิดว่าอะไรคือการทำให้รู้สึกฮึกเหิมกันละ? แต่พวกเราควรจะเรียกคนที่กลายมาเป็นชาวเอเชียคนแรกที่คว้าแชมป์หมากรุกระดับโลกรุ่นเยาวชนอายุ 18 ปี และยังกลายมาเป็นแกรนด์มาสเตอร์ชาวอินเดียคนแรกด้วยอายุ 19ปีเท่านั้น? นั้นเป็นจุดเริ่มต้นของเส้นทางสู่การเป็นแชมป์โลกสำหรับคุณ Viswanathan Anand คนที่กลายมาเป็นส่วนหนึ่งในหน้าประวติศาสตร์หมากรุกไปตลาดกาล ตอนนี้ก็มีอีกตำนานมาอยู่ในทีม InstaSpot แล้ว!


Borussia เป็นหนึ่งในสโมสรฟุตบอลขึ้นชื่อในประเทศเยอรมนี ที่ได้พิสูจน์ให้กับเหล่าแฟนๆเห็นแล้วถึงจิตวิญญาณของการแข่งขัน และการขึ้นมาสู่จุดสูงสุด เพื่อจะมุ่งหน้าสู่ความสำเร็จ การเทรดเองก็เหมือนกับการเล่นกีฬาอย่างมืออาชีพในการแข่งขัน โดยต้องมีความมั่นใจและการไม่หยุดนิ่ง เพื่อที่จะได้ "ผ่าน" จากสโมสร Borussia FC และขึ้นมาอยู่ในอันดับต้นไปพร้อมกับ InstaSpot!

Monday, as usual, was accompanied by an empty macroeconomic calendar. Important statistical data was not published in the European Union, the United Kingdom, and the United States.
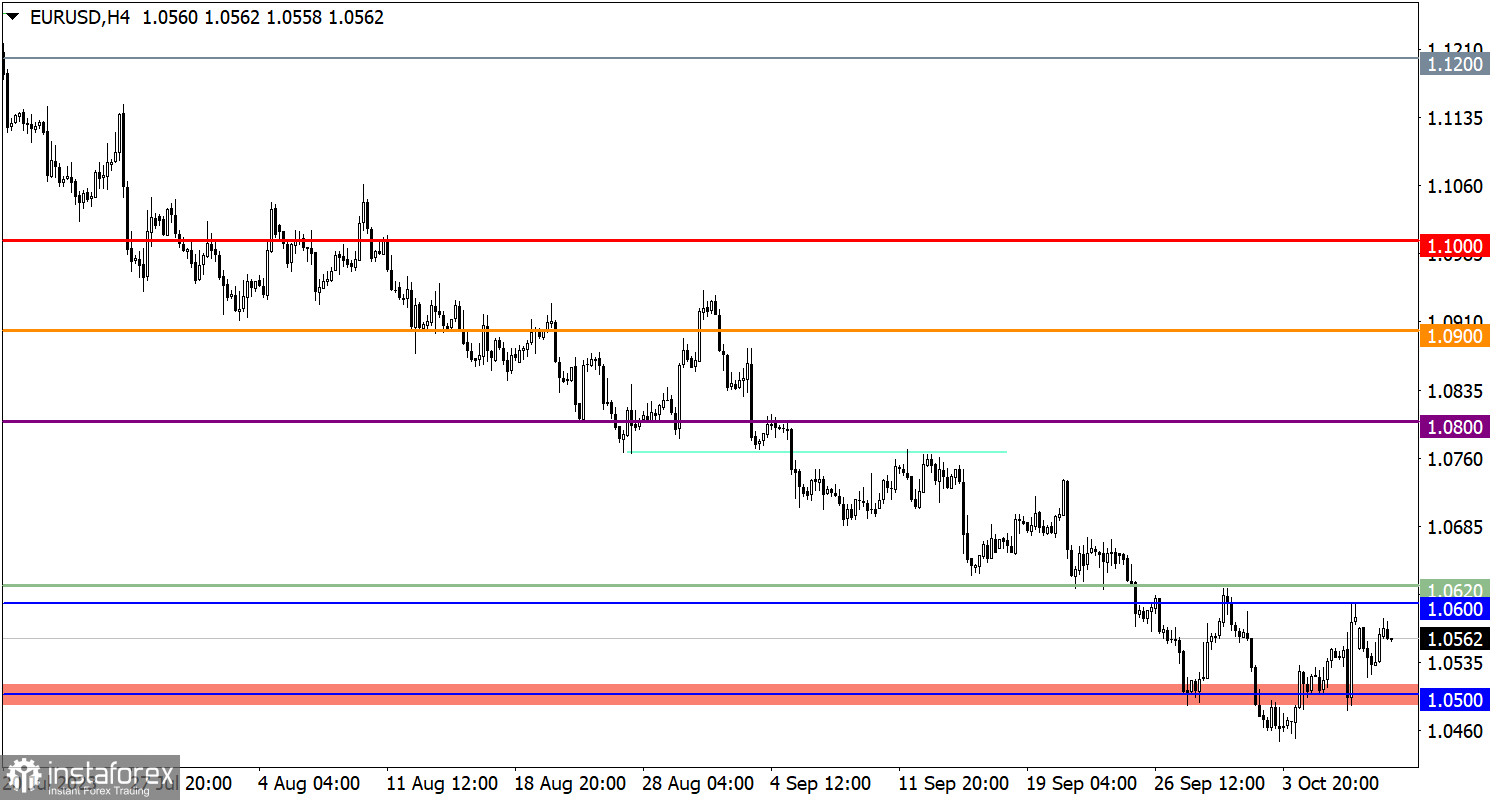
The EUR/USD currency pair continues to be in a correction phase despite a noticeable reduction in long positions' volume. Resistance in this pair is forming in the range of 1.0600–1.0620.
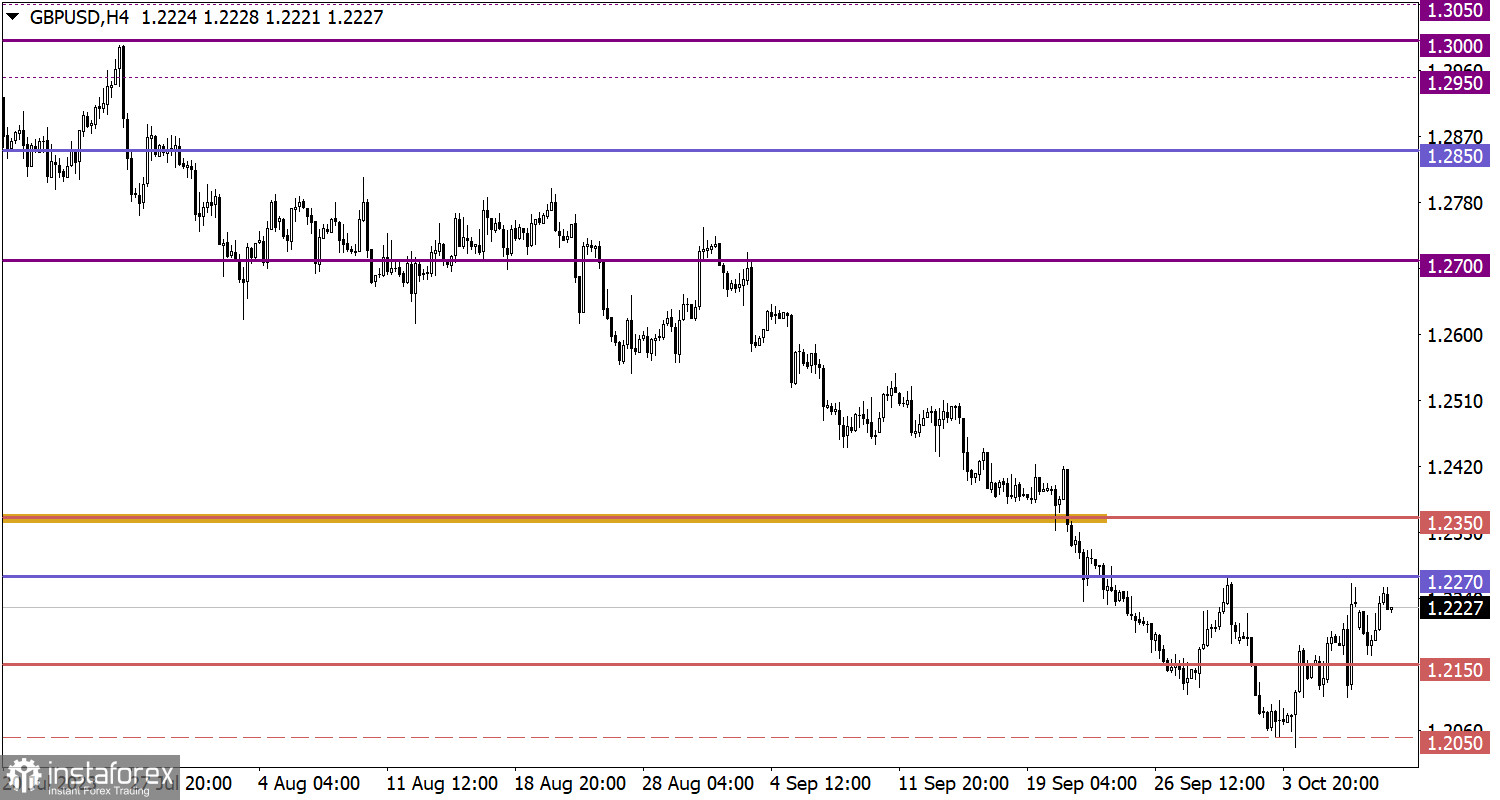
The GBP/USD pair, despite high volatility, remains at levels close to those of Friday. Currently, the corridor for this pair is forming between the levels of 1.2150 and 1.2270.
Tuesday looks similar to Monday in the sense that the macroeconomic calendar remains practically empty. The only event worth noting is the publication of the minutes of the Bank of England's Financial Policy Committee meeting. However, one should not expect anything new from this event; it is more likely to be a clarification of details.
To continue the upward movement, the price needs to stay above the resistance level area. In this case, one can expect growth towards the level of 1.0680. Otherwise, the price may fluctuate in the range between 1.0500 and 1.0600.
For further upward correction, it is necessary for the price to establish itself above the level of 1.2270. In this case, a gradual increase in the exchange rate towards the level of 1.2350 can be expected.
As for the downward scenario, an increase in short positions is expected if the price falls below the level of 1.2100. In this case, a local low may be updated, with support at the lower zone of the psychological level of 1.1950/1.2000.
The candlestick chart type is white and black graphic rectangles with lines above and below. With a detailed analysis of each individual candle, you can see its characteristics relative to a particular time frame: opening price, closing price, intraday high and low.
Horizontal levels are price coordinates, relative to which a price may stop or reverse its trajectory. In the market, these levels are called support and resistance.
Circles and rectangles are highlighted examples where the price reversed in history. This color highlighting indicates horizontal lines that may put pressure on the asset's price in the future.
The up/down arrows are landmarks of the possible price direction in the future.
*บทวิเคราะห์ในตลาดที่มีการโพสต์ตรงนี้ เพียงเพื่อทำให้คุณทราบถึงข้อมูล ไม่ได้เป็นการเจาะจงถึงขั้นตอนให้คุณทำการซื้อขายตาม
บทวิเคราะห์ของทาง InstaSpot จะทำให้คุณทราบถึงแนวโน้มของตลาด! ในการที่เป็นลูกค้าของทาง InstaSpot นั้นคุณจะได้รับการบริการเพื่อการซื้อขายอย่างเต็มประสิทธิภาพอย่างมากมาย


