


我们的团队有超过700万的操盘手!
我们每天都在一起努力改善交易。我们得到了很高的成绩,并继续前进。
世界各地数以百万计的操盘手的认可是我们工作的最大赞赏! 您做出了您的选择,我们将尽一切努力来满足您的期望!
我们是一个共同的伟大团队!
InstaSpot. 自豪地为您工作!


Monday, as usual, was accompanied by an empty macroeconomic calendar. Important statistical data was not published in the European Union, the United Kingdom, and the United States.
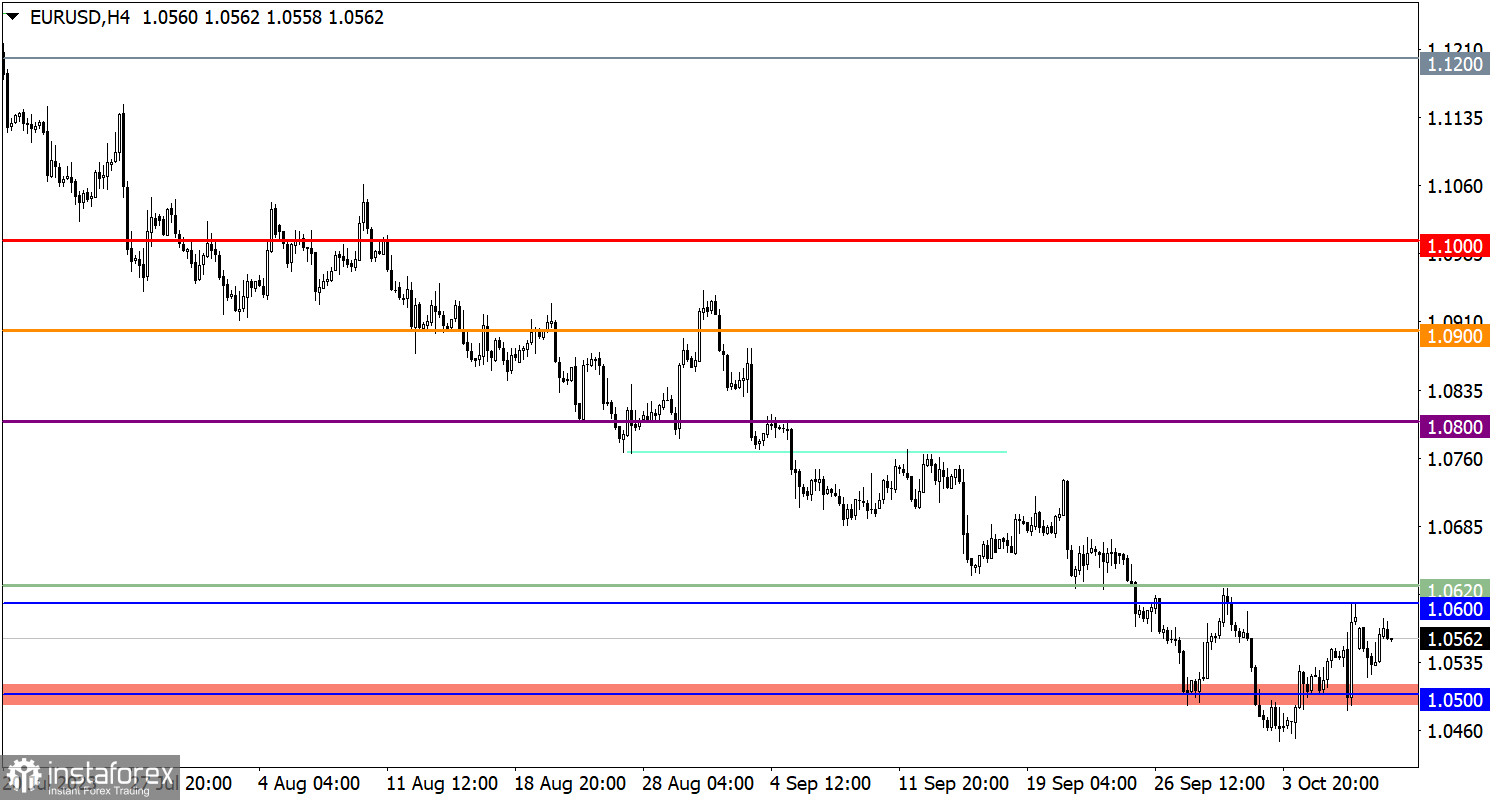
The EUR/USD currency pair continues to be in a correction phase despite a noticeable reduction in long positions' volume. Resistance in this pair is forming in the range of 1.0600–1.0620.
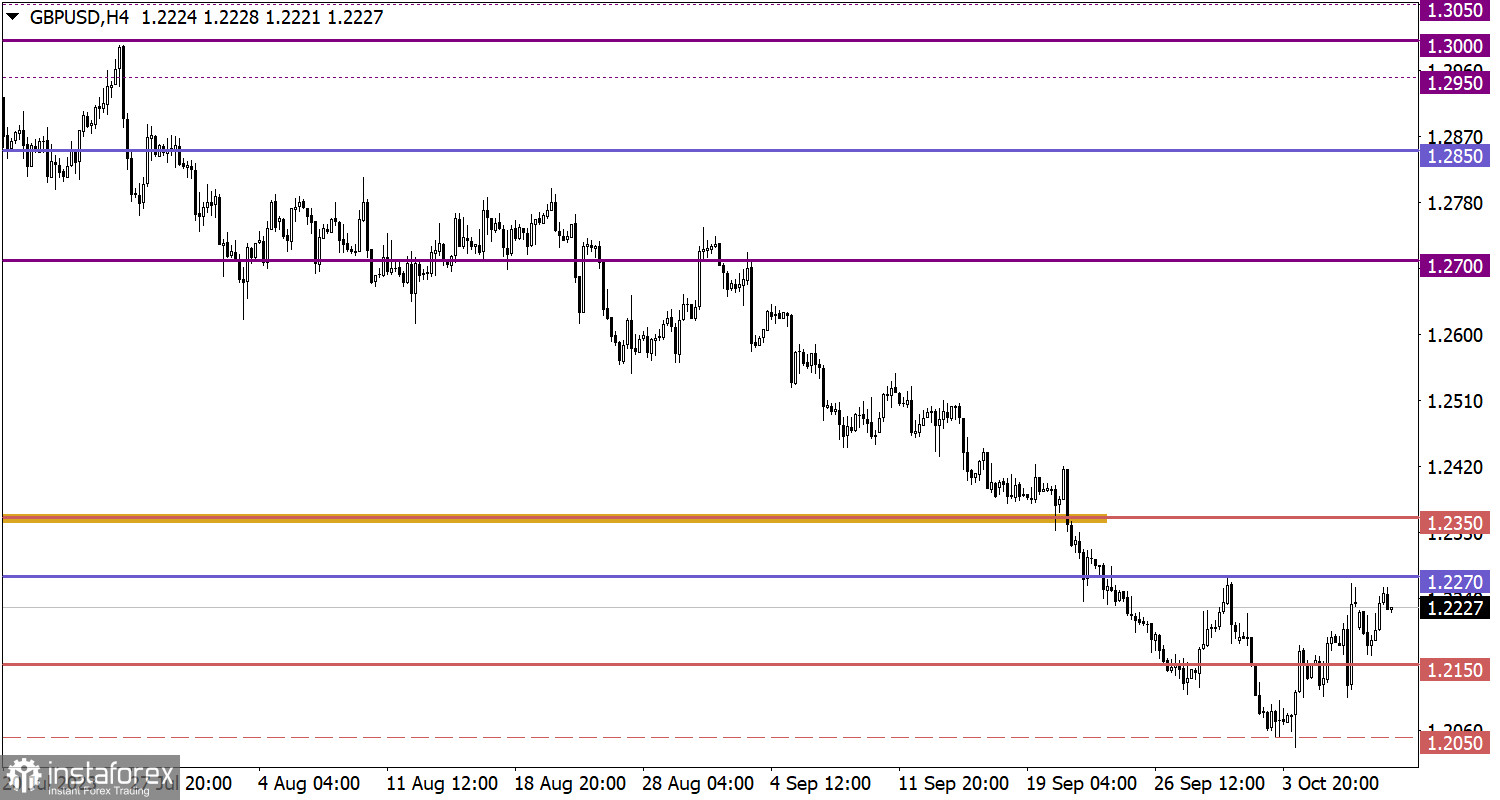
The GBP/USD pair, despite high volatility, remains at levels close to those of Friday. Currently, the corridor for this pair is forming between the levels of 1.2150 and 1.2270.
Tuesday looks similar to Monday in the sense that the macroeconomic calendar remains practically empty. The only event worth noting is the publication of the minutes of the Bank of England's Financial Policy Committee meeting. However, one should not expect anything new from this event; it is more likely to be a clarification of details.
To continue the upward movement, the price needs to stay above the resistance level area. In this case, one can expect growth towards the level of 1.0680. Otherwise, the price may fluctuate in the range between 1.0500 and 1.0600.
For further upward correction, it is necessary for the price to establish itself above the level of 1.2270. In this case, a gradual increase in the exchange rate towards the level of 1.2350 can be expected.
As for the downward scenario, an increase in short positions is expected if the price falls below the level of 1.2100. In this case, a local low may be updated, with support at the lower zone of the psychological level of 1.1950/1.2000.
The candlestick chart type is white and black graphic rectangles with lines above and below. With a detailed analysis of each individual candle, you can see its characteristics relative to a particular time frame: opening price, closing price, intraday high and low.
Horizontal levels are price coordinates, relative to which a price may stop or reverse its trajectory. In the market, these levels are called support and resistance.
Circles and rectangles are highlighted examples where the price reversed in history. This color highlighting indicates horizontal lines that may put pressure on the asset's price in the future.
The up/down arrows are landmarks of the possible price direction in the future.
*这里的市场分析是为了增加您对市场的了解,而不是给出交易的指示。
InstaSpot分析评论将让您充分了解市场趋势! 作为InstaSpot的客户,您将获得大量的免费服务以实现有效的交易。


