


Đội ngũ của chúng tôi có hơn 7,000,000 thương nhân!
Hàng ngày chúng tôi làm việc cùng nhau để cải thiện việc giao dịch. Chúng tôi nhận được kết quả cao và luôn tiến lên phía trước.
Sự công nhận của hàng triệu thương nhân trên toàn thế giới là sự đánh giá tốt nhất cho công việc của chúng tôi! Bạn đã đưa ra quyết định của mình và chúng tôi sẽ làm mọi thứ cần thiết để đáp ứng mong đợi của bạn!
Chúng ta cùng với nhau sẽ là một nhóm tuyệt vời!
InstaSpot. Tự hào làm việc cho bạn!


Diễn viên, nhà vô địch mùa giải UFC 6 và là người hùng thật sự!
Người tự mình làm nên tất cả. Người đàn ông đáng kể học hỏi.
Bí mật đằng sau thành công của Taktarov là sự cố gắng liên tục hướng tới mục tiêu.
Hãy khai phá tất cả các mặt tài năng của bạn!
Khám phá, thử, thất bại - nhưng không bao giờ dừng lại!
InstaSpot. Câu chuyện thành công của bạn bắt đầu từ đây!
Monday, as usual, was accompanied by an empty macroeconomic calendar. Important statistical data was not published in the European Union, the United Kingdom, and the United States.
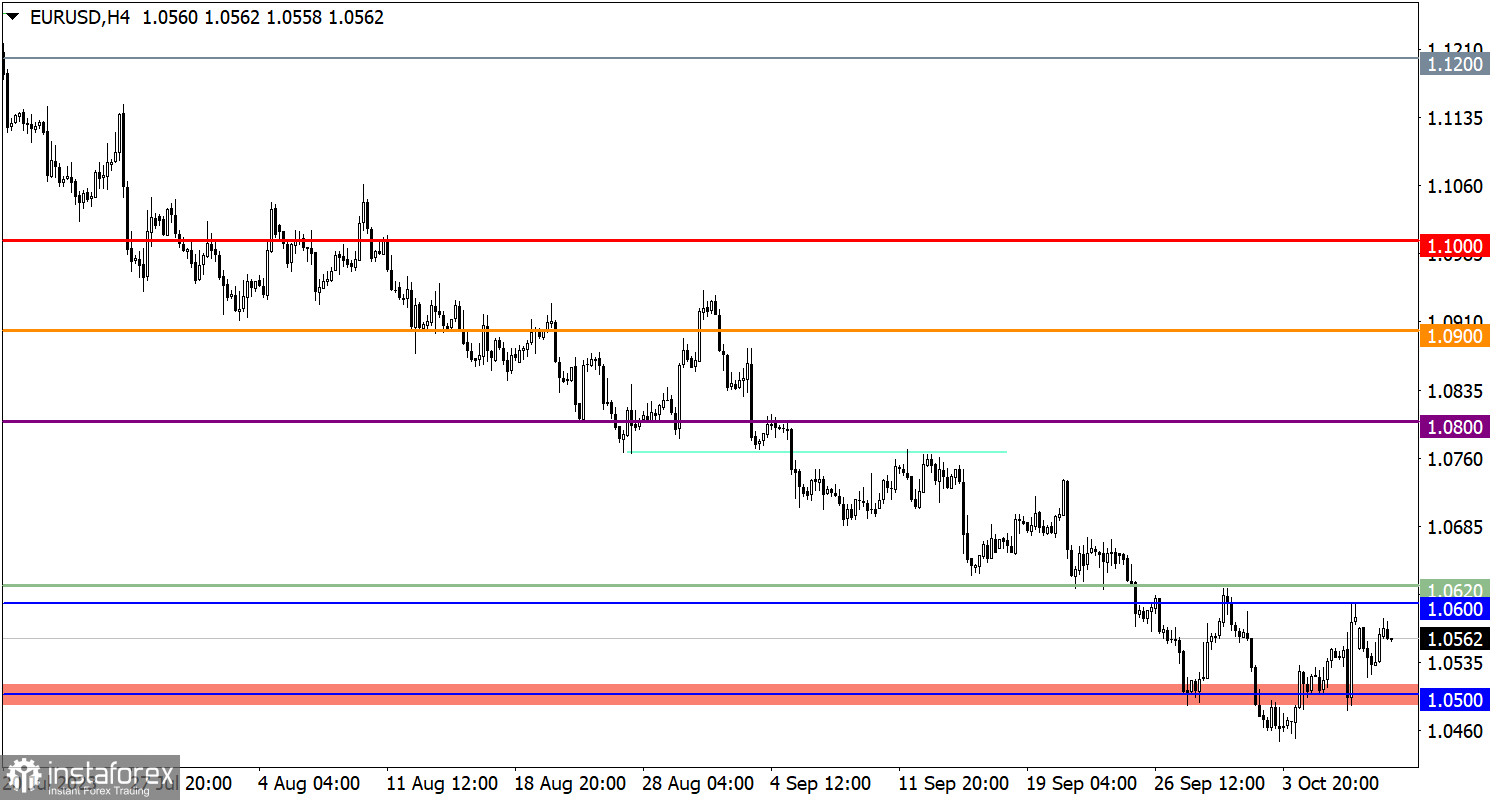
The EUR/USD currency pair continues to be in a correction phase despite a noticeable reduction in long positions' volume. Resistance in this pair is forming in the range of 1.0600–1.0620.
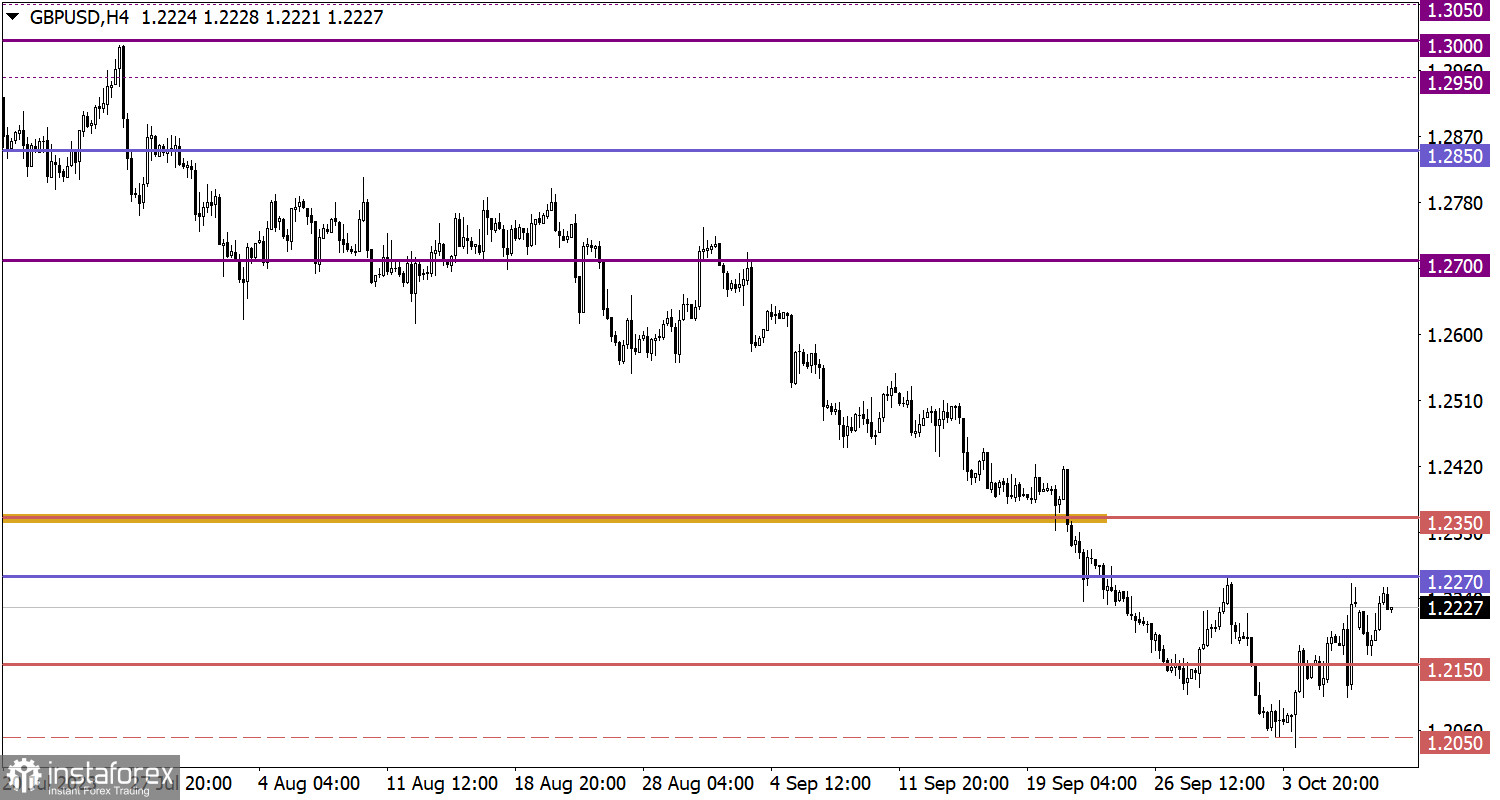
The GBP/USD pair, despite high volatility, remains at levels close to those of Friday. Currently, the corridor for this pair is forming between the levels of 1.2150 and 1.2270.

Tuesday looks similar to Monday in the sense that the macroeconomic calendar remains practically empty. The only event worth noting is the publication of the minutes of the Bank of England's Financial Policy Committee meeting. However, one should not expect anything new from this event; it is more likely to be a clarification of details.
To continue the upward movement, the price needs to stay above the resistance level area. In this case, one can expect growth towards the level of 1.0680. Otherwise, the price may fluctuate in the range between 1.0500 and 1.0600.
For further upward correction, it is necessary for the price to establish itself above the level of 1.2270. In this case, a gradual increase in the exchange rate towards the level of 1.2350 can be expected.
As for the downward scenario, an increase in short positions is expected if the price falls below the level of 1.2100. In this case, a local low may be updated, with support at the lower zone of the psychological level of 1.1950/1.2000.
The candlestick chart type is white and black graphic rectangles with lines above and below. With a detailed analysis of each individual candle, you can see its characteristics relative to a particular time frame: opening price, closing price, intraday high and low.
Horizontal levels are price coordinates, relative to which a price may stop or reverse its trajectory. In the market, these levels are called support and resistance.
Circles and rectangles are highlighted examples where the price reversed in history. This color highlighting indicates horizontal lines that may put pressure on the asset's price in the future.
The up/down arrows are landmarks of the possible price direction in the future.
*Phân tích thị trường được đăng tải ở đây có nghĩa là để gia tăng nhận thức của bạn, nhưng không đưa ra các chỉ dẫn để thực hiện một giao dịch.
InstaSpot analytical reviews will make you fully aware of market trends! Being an InstaSpot client, you are provided with a large number of free services for efficient trading.


