


La légende dans l'équipe InstaSpot!
La vraie légende! Vous pensez que c'est trop pathétique? Mais comment pouvez-vous appeler un homme qui, à 18 ans, est devenu le premier champion du monde d'échecs parmi les jeunes hommes d'Asie, et à dix-neuf ans – le premier grand maître de l'histoire de son pays? Ce fut le début de la voie du champion d'échecs –Viswanathan Anand – l'homme qui a inscrit son nom à jamais dans l'histoire des échecs du monde. Une autre légende dans l'équipe d'InstaSpot!


Le FC Borussia est l'un des clubs de football les plus titrés d'Allemagne, qui a prouvé à maintes reprises à ses fans que l'esprit de rivalité et de leadership mènera certainement au succès. Négociez de la même manière que les professionnels du sport mènent le jeu: en toute confiance et activement. Devenez un leader avec le FC Borussia et soyez en tête avec l'équipe InstaSpot!
Monday, as usual, was accompanied by an empty macroeconomic calendar. Important statistical data was not published in the European Union, the United Kingdom, and the United States.
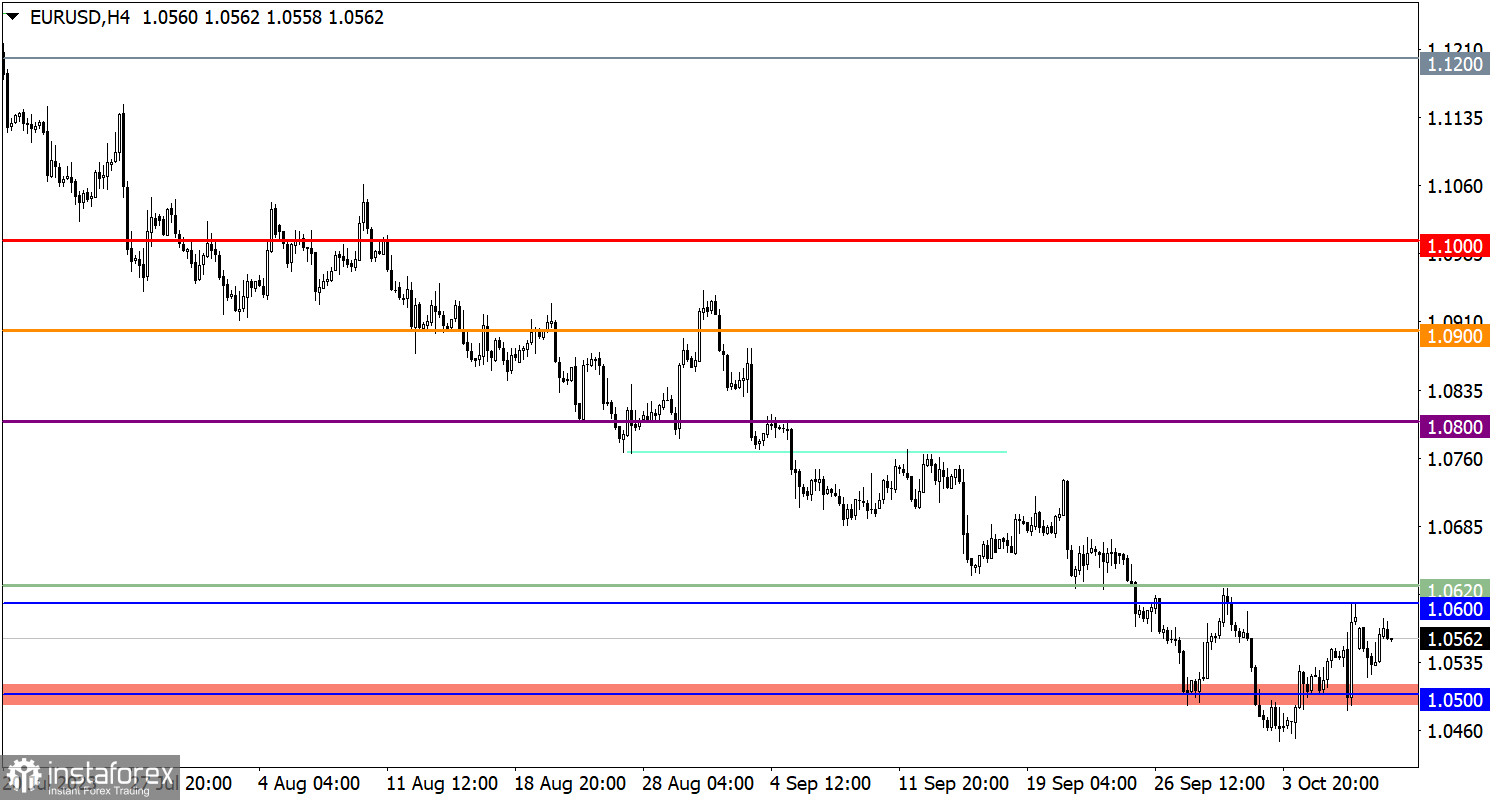
The EUR/USD currency pair continues to be in a correction phase despite a noticeable reduction in long positions' volume. Resistance in this pair is forming in the range of 1.0600–1.0620.
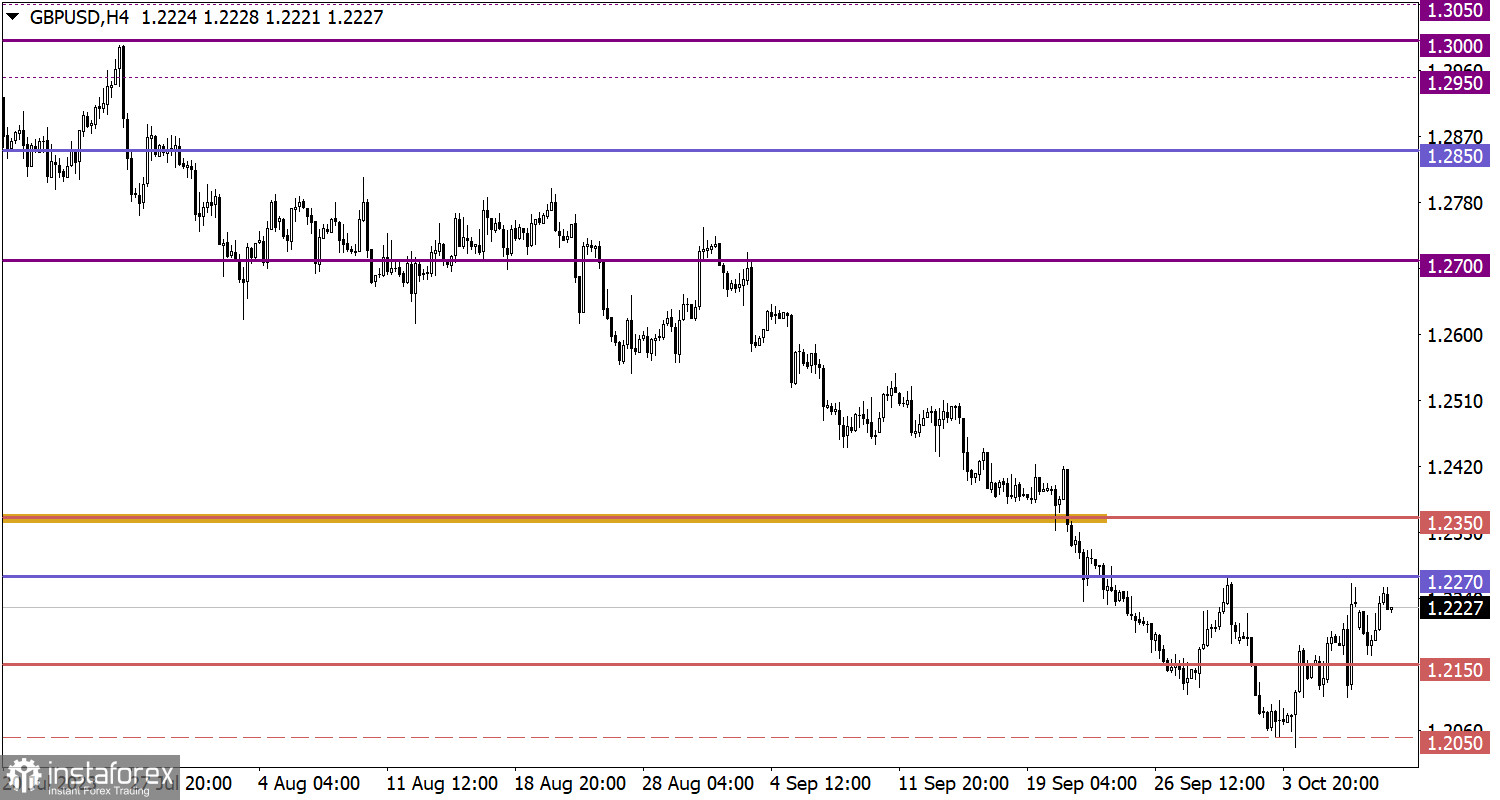
The GBP/USD pair, despite high volatility, remains at levels close to those of Friday. Currently, the corridor for this pair is forming between the levels of 1.2150 and 1.2270.
Tuesday looks similar to Monday in the sense that the macroeconomic calendar remains practically empty. The only event worth noting is the publication of the minutes of the Bank of England's Financial Policy Committee meeting. However, one should not expect anything new from this event; it is more likely to be a clarification of details.
To continue the upward movement, the price needs to stay above the resistance level area. In this case, one can expect growth towards the level of 1.0680. Otherwise, the price may fluctuate in the range between 1.0500 and 1.0600.
For further upward correction, it is necessary for the price to establish itself above the level of 1.2270. In this case, a gradual increase in the exchange rate towards the level of 1.2350 can be expected.
As for the downward scenario, an increase in short positions is expected if the price falls below the level of 1.2100. In this case, a local low may be updated, with support at the lower zone of the psychological level of 1.1950/1.2000.
The candlestick chart type is white and black graphic rectangles with lines above and below. With a detailed analysis of each individual candle, you can see its characteristics relative to a particular time frame: opening price, closing price, intraday high and low.
Horizontal levels are price coordinates, relative to which a price may stop or reverse its trajectory. In the market, these levels are called support and resistance.
Circles and rectangles are highlighted examples where the price reversed in history. This color highlighting indicates horizontal lines that may put pressure on the asset's price in the future.
The up/down arrows are landmarks of the possible price direction in the future.
*The market analysis posted here is meant to increase your awareness, but not to give instructions to make a trade.
InstaSpot analytical reviews will make you fully aware of market trends! Being an InstaSpot client, you are provided with a large number of free services for efficient trading.


