


Nella nostra squadra ci sono più di 7.000.000 trader! Ogni giorno ci impegniamo a far sì che il trading migliori. Conseguiamo grandi risultati e ci muoviamo in avanti.
Il riconoscimento da parte di milioni di trader in tutto il mondo rappresenta l'alta valutazione della nostra attività! Voi avete fatto la vostra scelta e noi faremo la nostra al fine di soddisfare le vostre aspettative!
Assieme siamo una grande squadra!
InstaSpot. Siamo orgogliosi di lavorare per voi!


Attore, campione del mondo di lotta libera e semplicemente un vero maciste russo! Persona venuta dal nulla. Persona che rispecchia i nostri obiettivi. Il segreto del successo di Taktarov consiste nel mirare continuamente al suo scopo.
Dischiudi anche tu tutti gli aspetti del tuo talento! Impara, prova, sbaglia, ma non fermarti!
InstaSpot - la storia delle tue vittorie inizia qui!

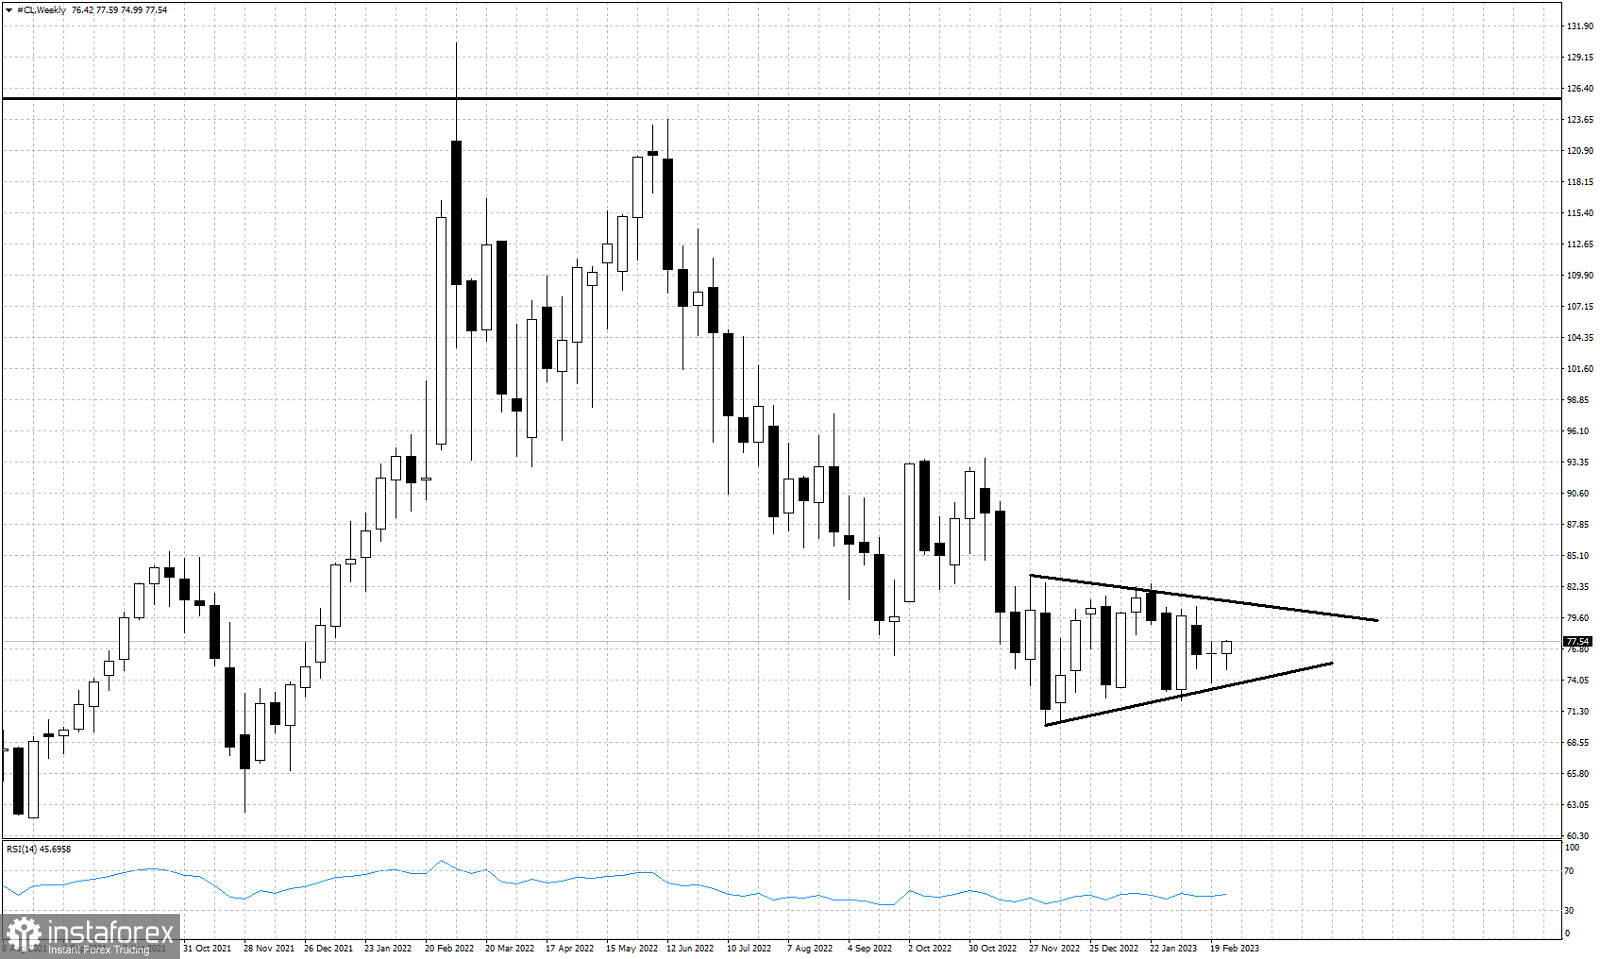
Black lines- triangle pattern
Oil price is trading around $77.50 at the last trading day of February. Price has made no real progress over the last 15 weeks. Price is trapped inside a trading range between $80 and $70. Near term trend is neutral with no clear direction. Price has formed a triangle pattern over the last 13 weeks. The upper triangle boundary is resistance at $80.70 and the lower triangle boundary provides support at $73.50.
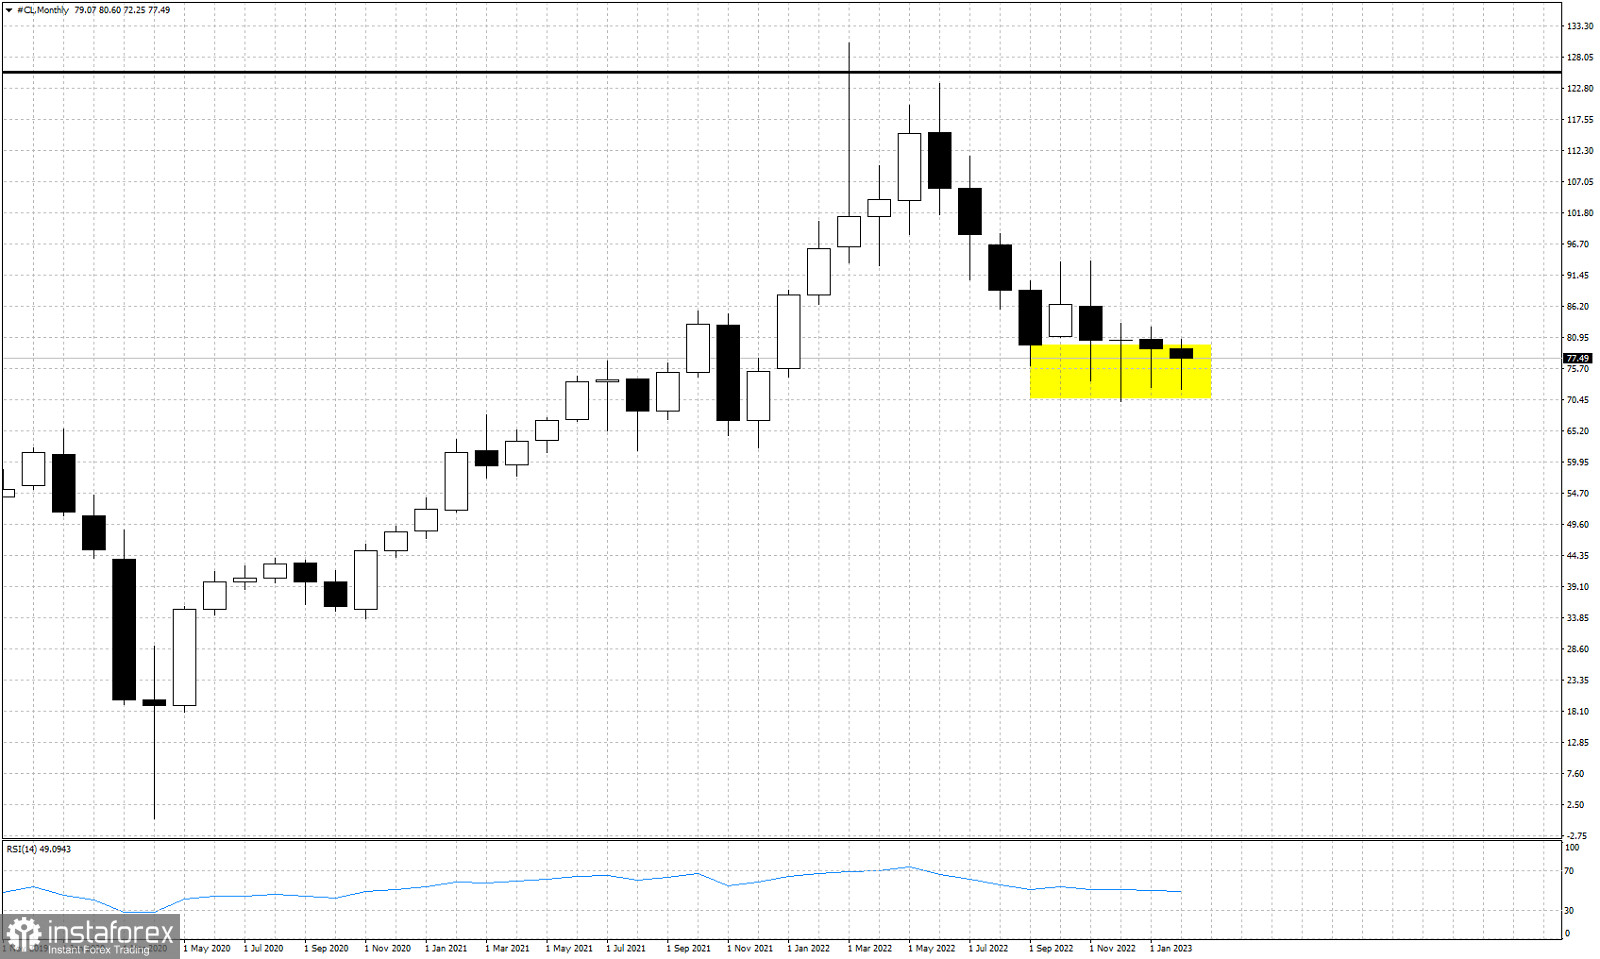
Yellow rectangle- support area
Over the last 4 months the candlestick pattern shows long lower tails. Such candlestick pattern is seen near the lows or the end of a trend. Oil price candlesticks confirm the importance of support around $70. Failure to hold above this level on a weekly and monthly basis would be a bearish sign.
*La presente analisi del mercato ha un carattere esclusivamente informativo e non rappresenta una guida per l`effettuazione di una transazione.
Le recensioni analitiche di InstaSpot ti renderanno pienamente consapevole delle tendenze del mercato! Essendo un cliente InstaSpot, ti viene fornito un gran numero di servizi gratuiti per il trading efficiente.


