


Tim kami memiliki lebih dari 7.000.000 trader!
Setiap harinya kami bekerja sama untuk meningkatkan trading. Kami memperoleh hasil tinggi dan terus bergerak maju.
Pengakuan dari jutaan trader diseluruh dunia merupakan apresiasi terbaik dari kerja kami! Anda membuat pilihan anda dan kami akan melakukan semua yang dibutuhkan untuk memenuhi ekspektasi anda!
We are a great team together!
InstaSpot. Bangga bekerja bersama anda!


Seorang Aktor, juara 6 turnamen UFC dan pahlawan sesungguhnya!
Pria yang berhasil. Pria yang berusaha keras.
Rahasia dibalik kesuksesan Taktarov adalah pergerakan konstan menuju target.
Tunjukkan seluruh sisi dari bakat anda!
Temukan, coba, gagal - namun jangan pernah berhenti!
InstaSpot. Cerita sukses anda dimulai disini!

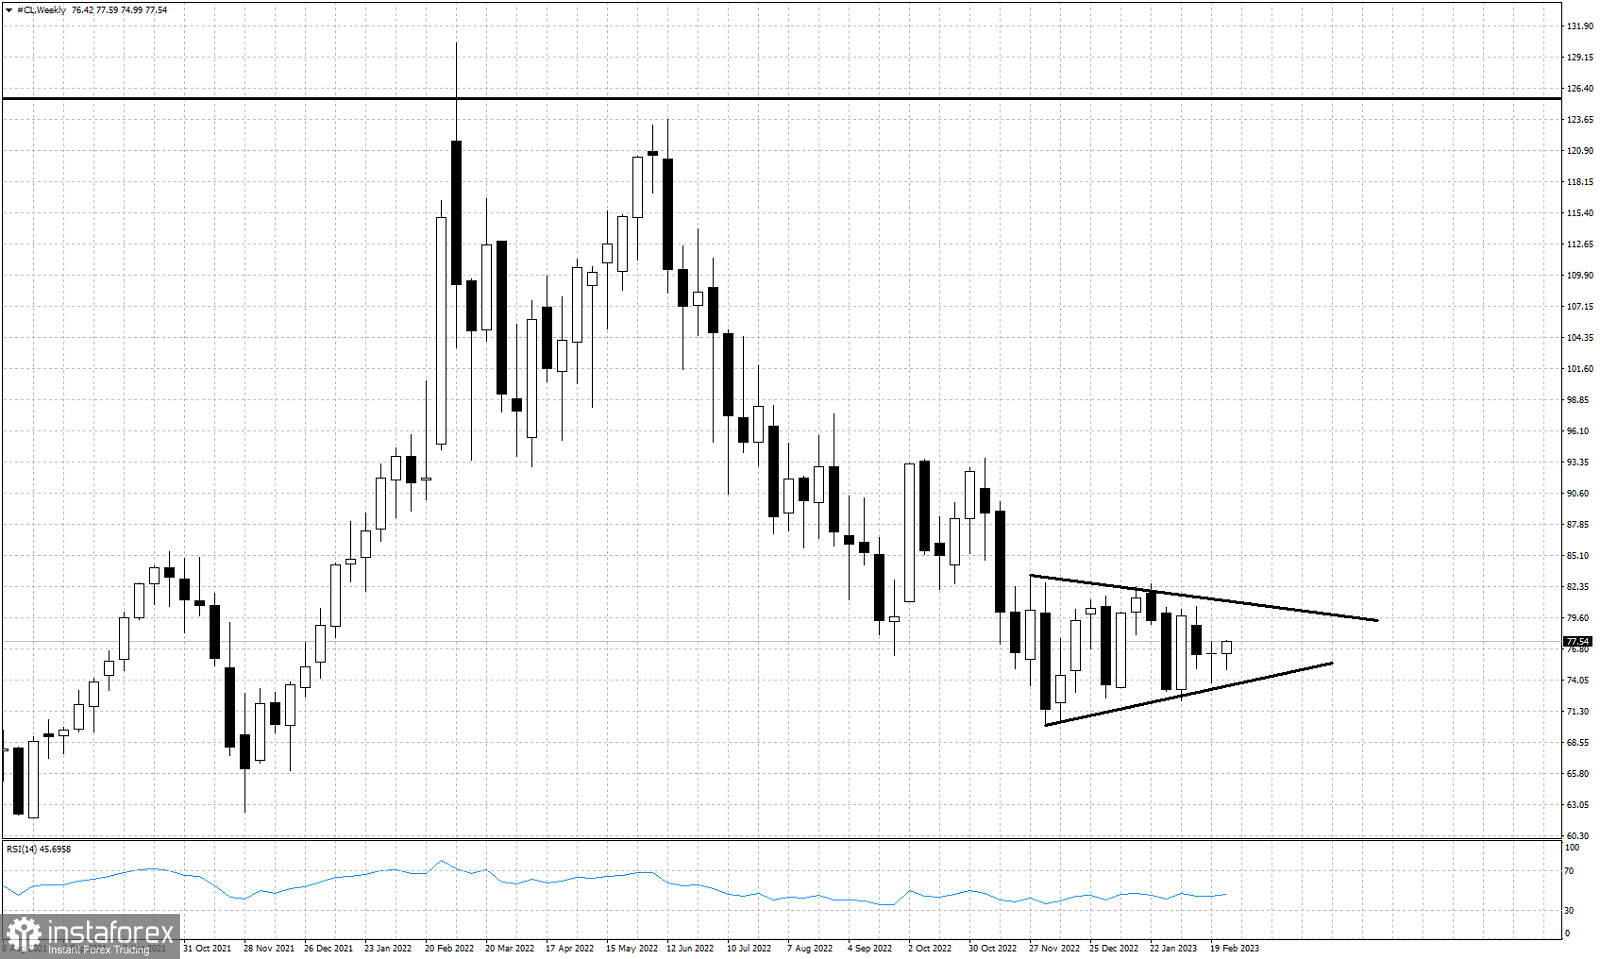
Black lines- triangle pattern
Oil price is trading around $77.50 at the last trading day of February. Price has made no real progress over the last 15 weeks. Price is trapped inside a trading range between $80 and $70. Near term trend is neutral with no clear direction. Price has formed a triangle pattern over the last 13 weeks. The upper triangle boundary is resistance at $80.70 and the lower triangle boundary provides support at $73.50.
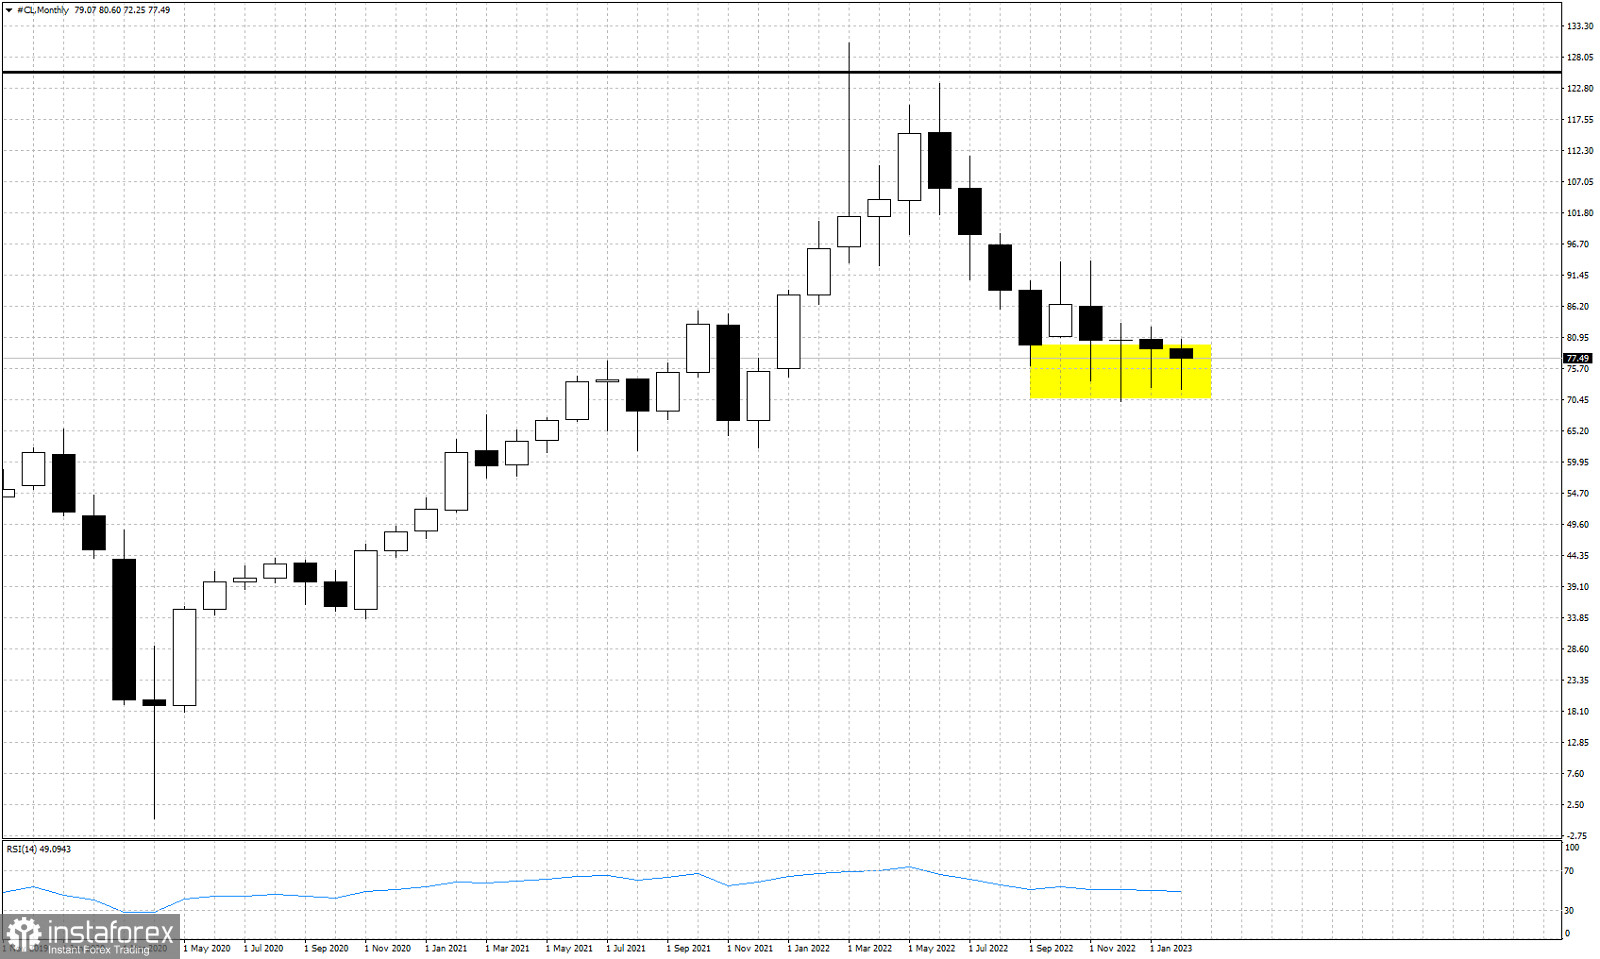
Yellow rectangle- support area
Over the last 4 months the candlestick pattern shows long lower tails. Such candlestick pattern is seen near the lows or the end of a trend. Oil price candlesticks confirm the importance of support around $70. Failure to hold above this level on a weekly and monthly basis would be a bearish sign.
*Analisis pasar yang diposting disini dimaksudkan untuk meningkatkan pengetahuan Anda namun tidak untuk memberi instruksi trading.
Tinjauan analitis InstaSpot akan membuat Anda menyadari sepenuhnya tren pasar! Sebagai klien InstaSpot, Anda dilengkapi dengan sejumlah besar layanan gratis untuk trading yang efisien.


