


Легендата в екипа на ИнстаФорекс!
Легенда! Мислите ли, че това е бомбастична реторика? Но как да наречем човек, който на 18 години стана първият азиатец спечелил световния шампионат по шах за юноши и на 19 години стана първият гросмайстор на Индия? Това беше началото на труден път към титлата на световен шампион за Вишванатан Ананд, човекът, който стана част от историята на шаха завинаги. Сега още една легенда в екипа на ИнстаФорекс!


Борусия е един от най-титулуваните футболни клубове в Германия, който многократно се е доказал пред феновете: духът на конкуренция и лидерство със сигурност ще доведе до успех. Търгувайте по същия начин, по който спортните професионалисти играят играта: уверено и активно. Запазете „пас" от ФК „Борусия" и бъдете начело с ИнстаФорекс!

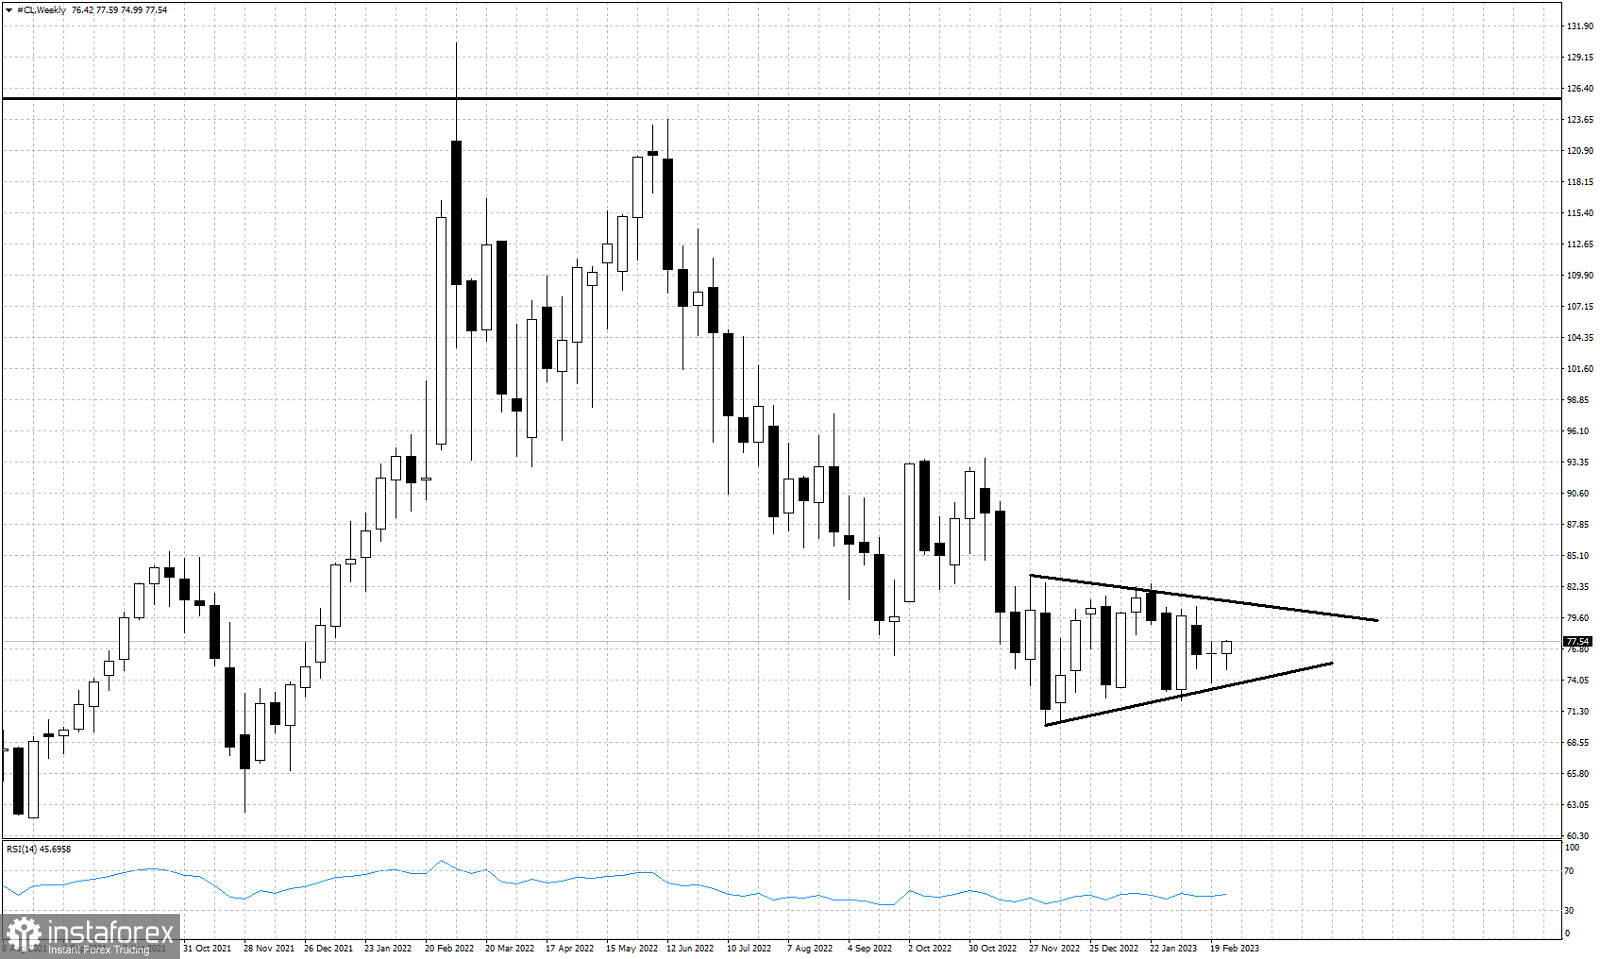
Black lines- triangle pattern
Oil price is trading around $77.50 at the last trading day of February. Price has made no real progress over the last 15 weeks. Price is trapped inside a trading range between $80 and $70. Near term trend is neutral with no clear direction. Price has formed a triangle pattern over the last 13 weeks. The upper triangle boundary is resistance at $80.70 and the lower triangle boundary provides support at $73.50.
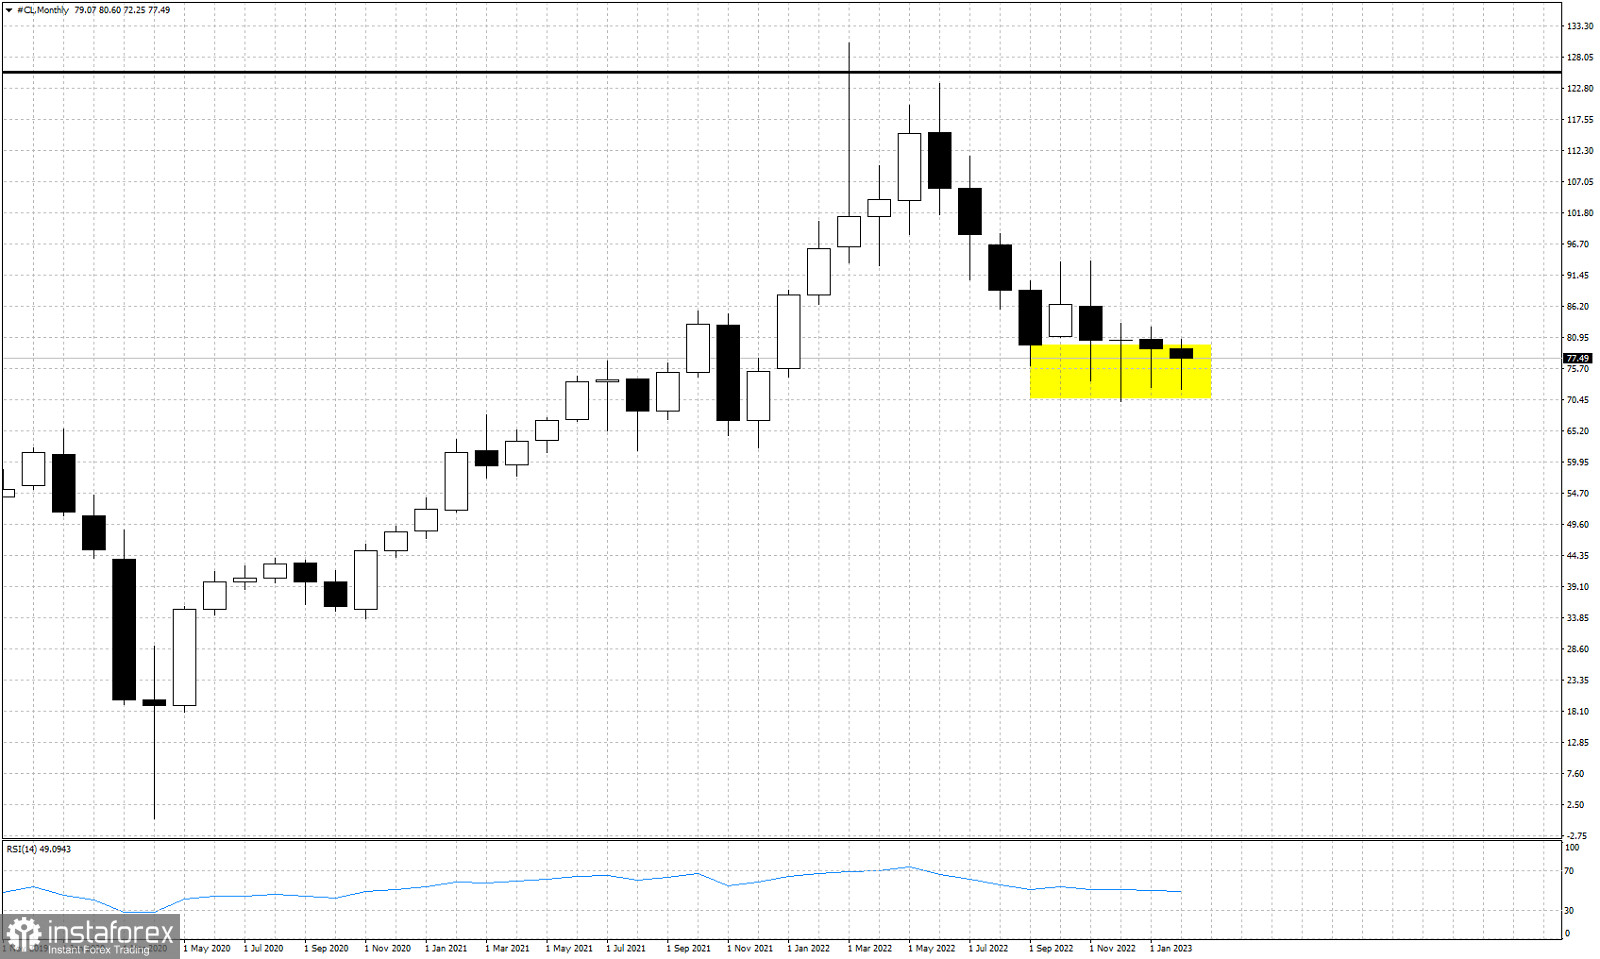
Yellow rectangle- support area
Over the last 4 months the candlestick pattern shows long lower tails. Such candlestick pattern is seen near the lows or the end of a trend. Oil price candlesticks confirm the importance of support around $70. Failure to hold above this level on a weekly and monthly basis would be a bearish sign.
*Анализът на пазара публикуван тук има за цел да повиши информираността Ви, но не и да дава указания за търговия.
Аналитичните прегледи на ИнстаФорекс ще ви запознаят изцяло с пазарните тенденции! Като клиент на ИнстаФорекс, на вас се предоставят голям брой безплатни услуги за ефикасна търговия.


